Please Answer the number 3 and to 5 question on the file below . Thank you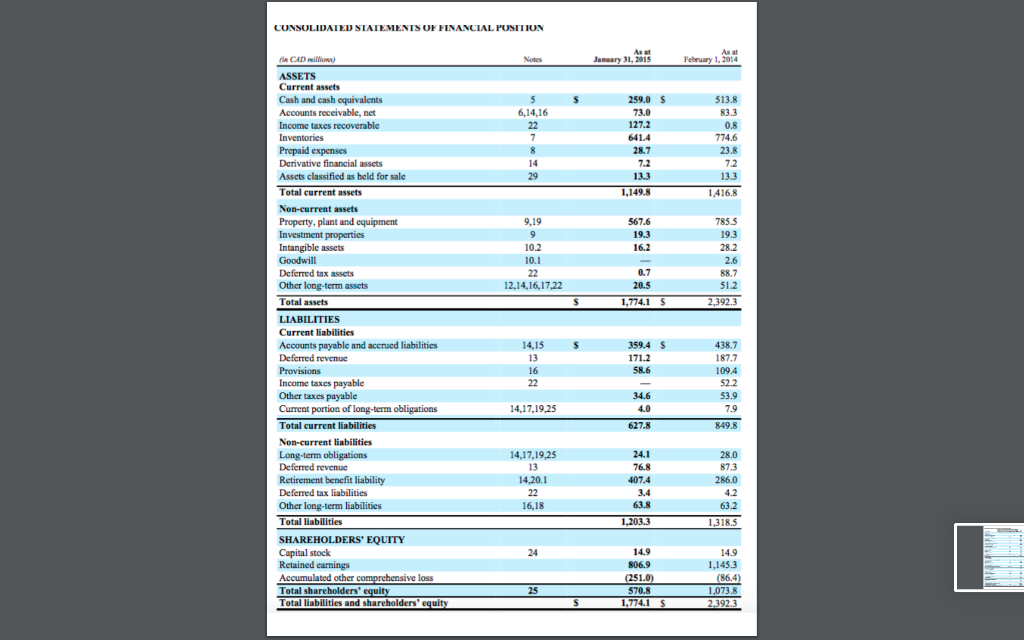
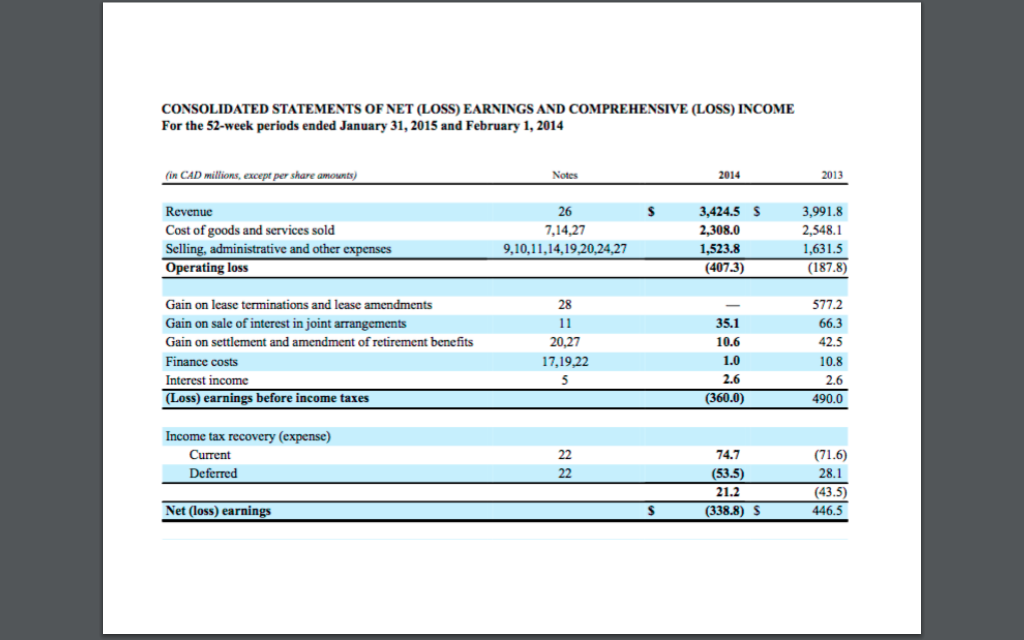
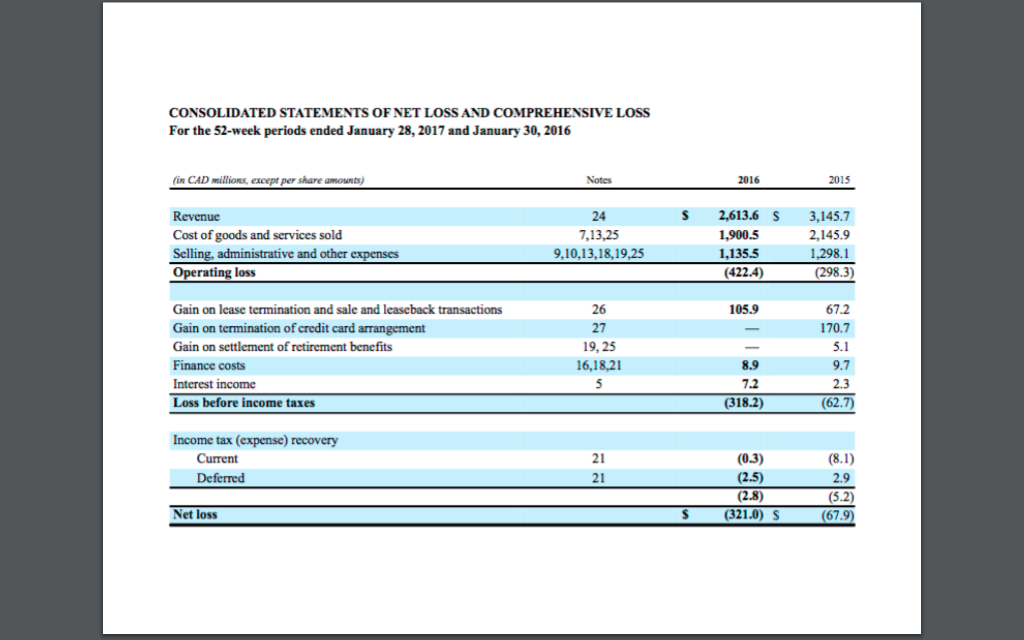
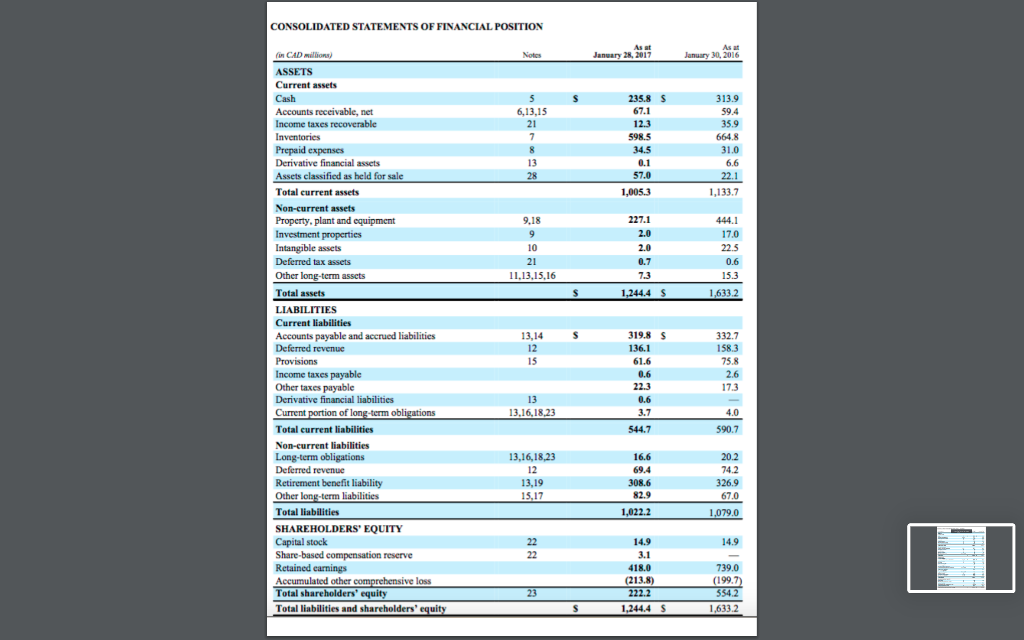
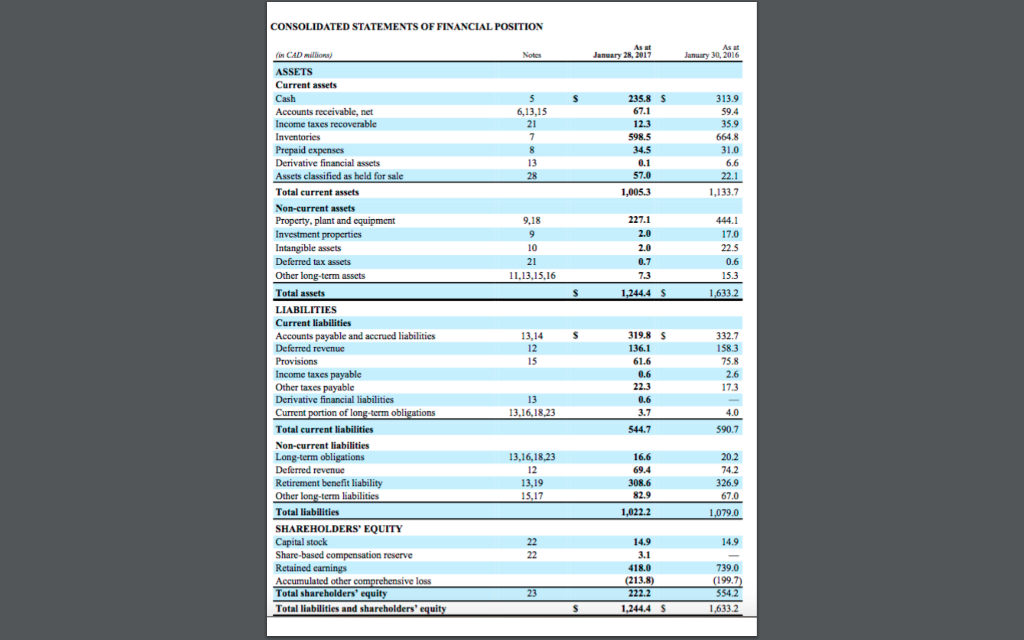
CONSOLIDATED STATEMENTS OF FINANCIAL POSITION Notes As at January 31, 2015 As at February 1, 2014 S 5 6,14,16 22 7 8 14 29 259,0 s 73.0 127.2 641.4 28.7 7.2 13.3 $13.8 83.3 0.8 774.6 23.8 72 13.3 1,416.8 1,149.8 567.6 19.3 16.2 9,19 9 10.2 10.1 22 12,14,16,17.22 785.5 19.3 28.2 2.6 88.7 51.2 2,392.3 0.7 20.5 $ 1,774.1 S fi CAD will ASSETS Current assets Cash and cash equivalents Accounts receivable, net Income taxes recoverable Inventories Prepaid expenses Derivative financial assets Assets classified as held for sale Total current assets Non-current assets Property, plant and equipment Investment properties Intangible assets Goodwill Deferred tax assets Other long-term assets Total assets LIABILITIES Current liabilities Accounts payable and accrued liabilities Deferred revenue Provisions Income taxes payable Other taxes payable Current portion of long-term obligations Total current liabilities Non-current liabilities Long-term obligations Deferred revenue Retirement benefit liability Deferred tax liabilities Other long-term liabilities Total liabilities SHAREHOLDERS' EQUITY Capital stock Retained earnings Accumulated other comprehensive loss Total shareholders' equity Total liabilities and shareholders' equity s 14,15 13 16 22 359.4 $ 171.2 58.6 438.7 187.7 109.4 52.2 53.9 7.9 849.8 34.6 4.0 14,17,19,25 627.8 14,17,19,25 13 14,20.1 22 16,18 24.1 76.8 407.4 3.4 63.8 1,203.3 28.0 87.3 286.0 4.2 63.2 1,318.5 24 14.9 806.9 (251.0) 570.8 1,774.15 14.9 1.145.3 (86.4) 1,073.8 2,392.3 25 $ CONSOLIDATED STATEMENTS OF NET (LOSS) EARNINGS AND COMPREHENSIVE (LOSS) INCOME For the 52-week periods ended January 31, 2015 and February 1, 2014 (in CAD millions, except per share amounts) Notes 2014 2013 s 3,424.5 s Revenue Cost of goods and services sold Selling, administrative and other expenses Operating loss 26 7,14,27 9,10,11,14,19,20,24,27 2.308.0 3,991.8 2,548.1 1,631.5 (187.8) 1,523.8 (407.3) Gain on lease terminations and lease amendments Gain on sale of interest in joint arrangements Gain on settlement and amendment of retirement benefits Finance costs Interest income (Loss) earnings before income taxes 28 u 20,27 17,19,22 5 35.1 10.6 1.0 2.6 (360.0) 577.2 66.3 42.5 10.8 2.6 490.0 Income tax recovery (expense) Current Deferred 22 22 74.7 (53.5) 21.2 (338.8) S (71.6) 28.1 (43.5) 446.5 Net (loss) earnings $ CONSOLIDATED STATEMENTS OF NET LOSS AND COMPREHENSIVE LOSS For the 52-week periods ended January 28, 2017 and January 30, 2016 in CAD millions, except per share amounts) Notes 2016 2015 s Revenue Cost of goods and services sold Selling, administrative and other expenses Operating loss 24 7,13,25 9,10,13,18,19,25 2.613.6 S 1,900.5 1,135.5 (422.4) 3,145.7 2,145.9 1,298.1 (298.3) 105.9 Gain on lease termination and sale and leaseback transactions Gain on termination of credit card arrangement Gain on settlement of retirement benefits Finance costs Interest income Loss before income taxes 26 27 19,25 16,18,21 5 67.2 170.7 5.1 9.7 2.3 (62.7) 8.9 7.2 (318.2) Income tax (expense) recovery Current Deferred 21 21 (0.3) (2.5) (2.8) (321.0) S (8.1) 2.9 (5.2) (67.9) Net loss $ CONSOLIDATED STATEMENTS OF FINANCIAL POSITION Notes As a January 28, 2017 As at January 30, 2016 5 6,13,15 21 7 8 13 28 235.8 67.1 12.3 598.5 34.5 0.1 57.0 313.9 59.4 35.9 664.8 31.0 6.6 22.1 1,133.7 1,005.3 227.1 9.18 9 9 10 21 11.13,15,16 2.0 2.0 0.7 444.1 17.0 22.5 0.6 15.3 s 1,244.45 1,633.2 on CAD million ASSETS Current assets Cash Accounts receivable, net Income taxes recoverable Inventories Prepaid expenses Derivative financial assets Assets classified as held for sale Total current assets Non-current assets Property, plant and equipment Investment properties Intangible assets Deferred tax assets Other long-term assets Total assets LIABILITIES Current liabilities Accounts payable and accrued liabilities Deferred revenue Provisions Income taxes payable Other taxes payable Derivative financial liabilities Current portion of long-term obligations Total current liabilities Non-current liabilities Long-term obligations Deferred revenue Retirement benefit liability Other long-term liabilities Total liabilities SHAREHOLDERS' EQUITY Capital stock Share-based compensation reserve Retained earnings Accumulated other comprehensive loss Total shareholders' equity Total liabilities and shareholders' equity s 13.14 12 15 319.8 $ 136.1 61.6 0.6 22.3 0.6 3.7 332.7 158.3 75.8 2.6 173 13 13.16.18.23 4.0 590.7 544.7 13,16,18,23 12 13,19 15,17 16.6 69.4 308.6 82.9 20.2 74.2 326.9 67.0 1,079.0 1,022.2 14.9 22 22 14.9 3.1 418.0 (213.8) 222.2 1,244.4 $ 739.0 (1997) 554.2 1.633.2 23 s CONSOLIDATED STATEMENTS OF FINANCIAL POSITION Notes As a January 28, 2017 As at January 30, 2016 5 6,13,15 21 7 8 13 28 235.8 67.1 12.3 598.5 34.5 0.1 57.0 313.9 59.4 35.9 664.8 31.0 6.6 22.1 1,133.7 1,005.3 227.1 9.18 9 9 10 21 11.13,15,16 2.0 2.0 0.7 444.1 17.0 22.5 0.6 15.3 s 1,244.45 1,633.2 on CAD million ASSETS Current assets Cash Accounts receivable, net Income taxes recoverable Inventories Prepaid expenses Derivative financial assets Assets classified as held for sale Total current assets Non-current assets Property, plant and equipment Investment properties Intangible assets Deferred tax assets Other long-term assets Total assets LIABILITIES Current liabilities Accounts payable and accrued liabilities Deferred revenue Provisions Income taxes payable Other taxes payable Derivative financial liabilities Current portion of long-term obligations Total current liabilities Non-current liabilities Long-term obligations Deferred revenue Retirement benefit liability Other long-term liabilities Total liabilities SHAREHOLDERS' EQUITY Capital stock Share-based compensation reserve Retained earnings Accumulated other comprehensive loss Total shareholders' equity Total liabilities and shareholders' equity s 13.14 12 15 319.8 $ 136.1 61.6 0.6 22.3 0.6 3.7 332.7 158.3 75.8 2.6 173 13 13.16.18.23 4.0 590.7 544.7 13,16,18,23 12 13,19 15,17 16.6 69.4 308.6 82.9 20.2 74.2 326.9 67.0 1,079.0 1,022.2 14.9 22 22 14.9 3.1 418.0 (213.8) 222.2 1,244.4 $ 739.0 (1997) 554.2 1.633.2 23 s ACCT 1036 - GROUP PROJECT ASSIGNMENT INSTRUCTIONS (10%) Your Group will perform a Financial Analysis on 4 years worth of a Canadian Public Company's Financial Statements, specifically a well known retailer. I will provide the Financial Statements to each Group along with Industry Averages. Your analysis will be summarized in a Power Point and you will present it at the beginning of our class in Week 14. You will email me your presentation prior to 6pm the day before our class. LATE submissions receive ZERO You do not have to write a full report. You will prepare your Presentation in point/bullet form. Groups will be given time to work on the Assignment in the second half of each class after the break. I'll be available to answer any questions you might have! Here are the details of the steps you will take: 1) Prepare a cover slide with the names of Group members/student numbers 2) Prepare a very brief history on the Company on 2 slides 3) Calculate the following for each of the 4 years and summarize each one on a separate slide. Show Calculations. Discuss direction and magnitude of any trends: Current Ratio Debt Ratio Gross Margin Gross Margin Percentage Profit Margin Inventory Turnover (for the most recent 3 years only) IMPORTANT: ONLY use the definitions and formulas from the Financial Statement Analysis materials in Course Documents in BB. Don't Google these definitions, they may be different or inaccurate in other web sites. 4) Compare select ratios to the Industry Averages provide to you and comment on your company's performance compared to the Industry 5) Conclusion - Would you buy shares in this company with your $1,000? -Briefly explain why or why not. NOTE: There are no extensions available for any reason. Late submissions will receive a grade of ZERO. Only 1 person needs to email me the Group Power Point. CONSOLIDATED STATEMENTS OF FINANCIAL POSITION Notes As at January 31, 2015 As at February 1, 2014 S 5 6,14,16 22 7 8 14 29 259,0 s 73.0 127.2 641.4 28.7 7.2 13.3 $13.8 83.3 0.8 774.6 23.8 72 13.3 1,416.8 1,149.8 567.6 19.3 16.2 9,19 9 10.2 10.1 22 12,14,16,17.22 785.5 19.3 28.2 2.6 88.7 51.2 2,392.3 0.7 20.5 $ 1,774.1 S fi CAD will ASSETS Current assets Cash and cash equivalents Accounts receivable, net Income taxes recoverable Inventories Prepaid expenses Derivative financial assets Assets classified as held for sale Total current assets Non-current assets Property, plant and equipment Investment properties Intangible assets Goodwill Deferred tax assets Other long-term assets Total assets LIABILITIES Current liabilities Accounts payable and accrued liabilities Deferred revenue Provisions Income taxes payable Other taxes payable Current portion of long-term obligations Total current liabilities Non-current liabilities Long-term obligations Deferred revenue Retirement benefit liability Deferred tax liabilities Other long-term liabilities Total liabilities SHAREHOLDERS' EQUITY Capital stock Retained earnings Accumulated other comprehensive loss Total shareholders' equity Total liabilities and shareholders' equity s 14,15 13 16 22 359.4 $ 171.2 58.6 438.7 187.7 109.4 52.2 53.9 7.9 849.8 34.6 4.0 14,17,19,25 627.8 14,17,19,25 13 14,20.1 22 16,18 24.1 76.8 407.4 3.4 63.8 1,203.3 28.0 87.3 286.0 4.2 63.2 1,318.5 24 14.9 806.9 (251.0) 570.8 1,774.15 14.9 1.145.3 (86.4) 1,073.8 2,392.3 25 $ CONSOLIDATED STATEMENTS OF NET (LOSS) EARNINGS AND COMPREHENSIVE (LOSS) INCOME For the 52-week periods ended January 31, 2015 and February 1, 2014 (in CAD millions, except per share amounts) Notes 2014 2013 s 3,424.5 s Revenue Cost of goods and services sold Selling, administrative and other expenses Operating loss 26 7,14,27 9,10,11,14,19,20,24,27 2.308.0 3,991.8 2,548.1 1,631.5 (187.8) 1,523.8 (407.3) Gain on lease terminations and lease amendments Gain on sale of interest in joint arrangements Gain on settlement and amendment of retirement benefits Finance costs Interest income (Loss) earnings before income taxes 28 u 20,27 17,19,22 5 35.1 10.6 1.0 2.6 (360.0) 577.2 66.3 42.5 10.8 2.6 490.0 Income tax recovery (expense) Current Deferred 22 22 74.7 (53.5) 21.2 (338.8) S (71.6) 28.1 (43.5) 446.5 Net (loss) earnings $ CONSOLIDATED STATEMENTS OF NET LOSS AND COMPREHENSIVE LOSS For the 52-week periods ended January 28, 2017 and January 30, 2016 in CAD millions, except per share amounts) Notes 2016 2015 s Revenue Cost of goods and services sold Selling, administrative and other expenses Operating loss 24 7,13,25 9,10,13,18,19,25 2.613.6 S 1,900.5 1,135.5 (422.4) 3,145.7 2,145.9 1,298.1 (298.3) 105.9 Gain on lease termination and sale and leaseback transactions Gain on termination of credit card arrangement Gain on settlement of retirement benefits Finance costs Interest income Loss before income taxes 26 27 19,25 16,18,21 5 67.2 170.7 5.1 9.7 2.3 (62.7) 8.9 7.2 (318.2) Income tax (expense) recovery Current Deferred 21 21 (0.3) (2.5) (2.8) (321.0) S (8.1) 2.9 (5.2) (67.9) Net loss $ CONSOLIDATED STATEMENTS OF FINANCIAL POSITION Notes As a January 28, 2017 As at January 30, 2016 5 6,13,15 21 7 8 13 28 235.8 67.1 12.3 598.5 34.5 0.1 57.0 313.9 59.4 35.9 664.8 31.0 6.6 22.1 1,133.7 1,005.3 227.1 9.18 9 9 10 21 11.13,15,16 2.0 2.0 0.7 444.1 17.0 22.5 0.6 15.3 s 1,244.45 1,633.2 on CAD million ASSETS Current assets Cash Accounts receivable, net Income taxes recoverable Inventories Prepaid expenses Derivative financial assets Assets classified as held for sale Total current assets Non-current assets Property, plant and equipment Investment properties Intangible assets Deferred tax assets Other long-term assets Total assets LIABILITIES Current liabilities Accounts payable and accrued liabilities Deferred revenue Provisions Income taxes payable Other taxes payable Derivative financial liabilities Current portion of long-term obligations Total current liabilities Non-current liabilities Long-term obligations Deferred revenue Retirement benefit liability Other long-term liabilities Total liabilities SHAREHOLDERS' EQUITY Capital stock Share-based compensation reserve Retained earnings Accumulated other comprehensive loss Total shareholders' equity Total liabilities and shareholders' equity s 13.14 12 15 319.8 $ 136.1 61.6 0.6 22.3 0.6 3.7 332.7 158.3 75.8 2.6 173 13 13.16.18.23 4.0 590.7 544.7 13,16,18,23 12 13,19 15,17 16.6 69.4 308.6 82.9 20.2 74.2 326.9 67.0 1,079.0 1,022.2 14.9 22 22 14.9 3.1 418.0 (213.8) 222.2 1,244.4 $ 739.0 (1997) 554.2 1.633.2 23 s CONSOLIDATED STATEMENTS OF FINANCIAL POSITION Notes As a January 28, 2017 As at January 30, 2016 5 6,13,15 21 7 8 13 28 235.8 67.1 12.3 598.5 34.5 0.1 57.0 313.9 59.4 35.9 664.8 31.0 6.6 22.1 1,133.7 1,005.3 227.1 9.18 9 9 10 21 11.13,15,16 2.0 2.0 0.7 444.1 17.0 22.5 0.6 15.3 s 1,244.45 1,633.2 on CAD million ASSETS Current assets Cash Accounts receivable, net Income taxes recoverable Inventories Prepaid expenses Derivative financial assets Assets classified as held for sale Total current assets Non-current assets Property, plant and equipment Investment properties Intangible assets Deferred tax assets Other long-term assets Total assets LIABILITIES Current liabilities Accounts payable and accrued liabilities Deferred revenue Provisions Income taxes payable Other taxes payable Derivative financial liabilities Current portion of long-term obligations Total current liabilities Non-current liabilities Long-term obligations Deferred revenue Retirement benefit liability Other long-term liabilities Total liabilities SHAREHOLDERS' EQUITY Capital stock Share-based compensation reserve Retained earnings Accumulated other comprehensive loss Total shareholders' equity Total liabilities and shareholders' equity s 13.14 12 15 319.8 $ 136.1 61.6 0.6 22.3 0.6 3.7 332.7 158.3 75.8 2.6 173 13 13.16.18.23 4.0 590.7 544.7 13,16,18,23 12 13,19 15,17 16.6 69.4 308.6 82.9 20.2 74.2 326.9 67.0 1,079.0 1,022.2 14.9 22 22 14.9 3.1 418.0 (213.8) 222.2 1,244.4 $ 739.0 (1997) 554.2 1.633.2 23 s ACCT 1036 - GROUP PROJECT ASSIGNMENT INSTRUCTIONS (10%) Your Group will perform a Financial Analysis on 4 years worth of a Canadian Public Company's Financial Statements, specifically a well known retailer. I will provide the Financial Statements to each Group along with Industry Averages. Your analysis will be summarized in a Power Point and you will present it at the beginning of our class in Week 14. You will email me your presentation prior to 6pm the day before our class. LATE submissions receive ZERO You do not have to write a full report. You will prepare your Presentation in point/bullet form. Groups will be given time to work on the Assignment in the second half of each class after the break. I'll be available to answer any questions you might have! Here are the details of the steps you will take: 1) Prepare a cover slide with the names of Group members/student numbers 2) Prepare a very brief history on the Company on 2 slides 3) Calculate the following for each of the 4 years and summarize each one on a separate slide. Show Calculations. Discuss direction and magnitude of any trends: Current Ratio Debt Ratio Gross Margin Gross Margin Percentage Profit Margin Inventory Turnover (for the most recent 3 years only) IMPORTANT: ONLY use the definitions and formulas from the Financial Statement Analysis materials in Course Documents in BB. Don't Google these definitions, they may be different or inaccurate in other web sites. 4) Compare select ratios to the Industry Averages provide to you and comment on your company's performance compared to the Industry 5) Conclusion - Would you buy shares in this company with your $1,000? -Briefly explain why or why not. NOTE: There are no extensions available for any reason. Late submissions will receive a grade of ZERO. Only 1 person needs to email me the Group Power Point