Please answer the orange/ highlighted areas utilizing the Excel function and formula. Thank You!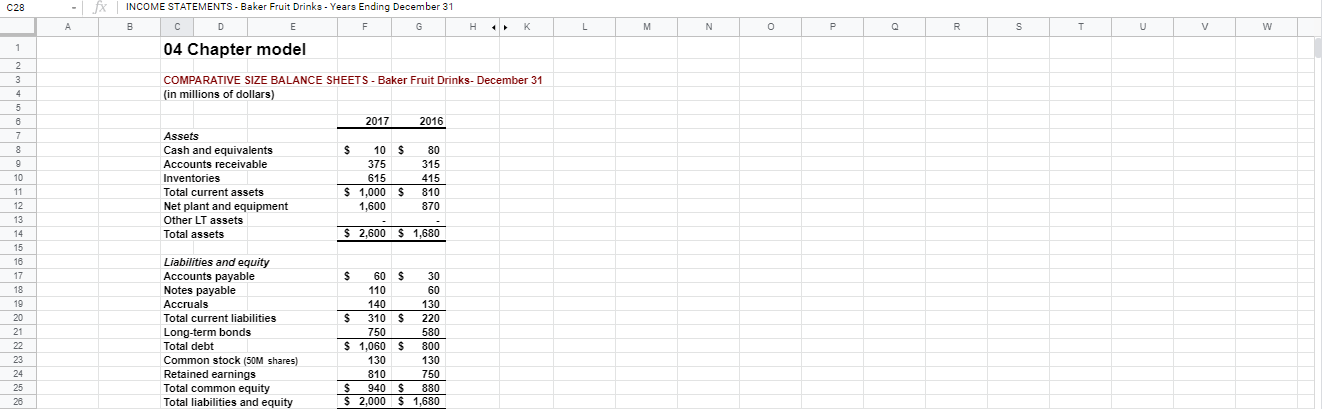
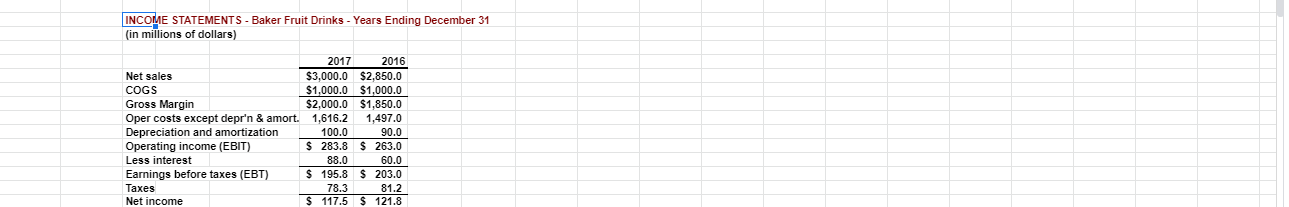
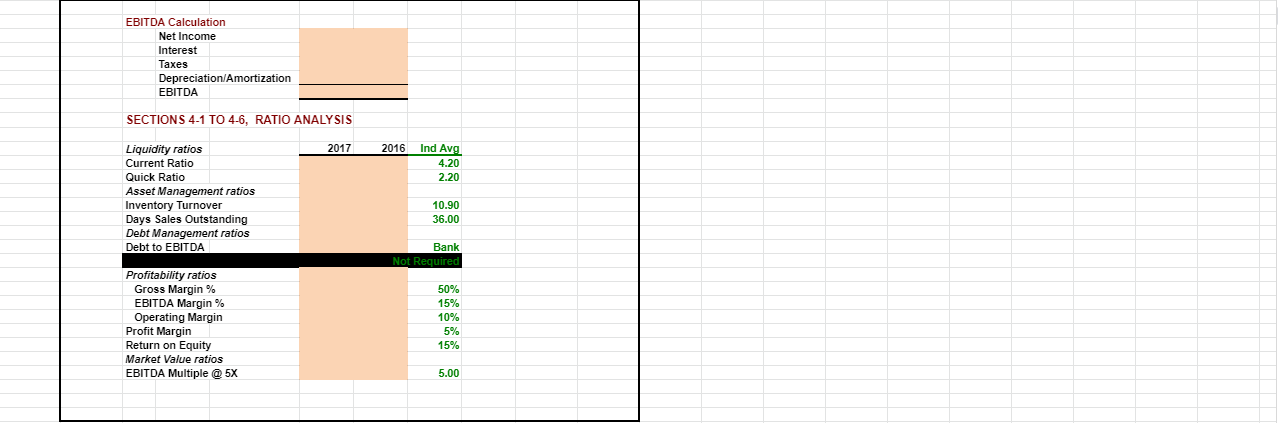
C28 A F H K L L M M N N o R S T U - fx INCOME STATEMENTS - Baker Fruit Drinks - Years Ending December 31 B D E G 04 Chapter model V w 1 2 3 4 5 5 6 7 COMPARATIVE SIZE BALANCE SHEETS - Baker Fruit Drinks- December 31 (in millions of dollars) 2017 2016 8 9 Assets Cash and equivalents Accounts receivable Inventories Total current assets Net plant and equipment Other LT assets Total assets $ 10 $ 375 615 $ 1,000 $ 1,600 80 315 415 810 870 10 11 12 13 14 15 16 17 18 $ 2,600 $ 1,680 19 20 21 22 23 24 25 28 Liabilities and equity Accounts payable Notes payable Accruals Total current liabilities Long-term bonds Total debt Common stock (50M shares) Retained earnings Total common equity Total liabilities and equity $ 60 $ 30 110 60 140 130 $ 310 $ 220 750 580 $ 1,060 $ 800 130 130 810 750 $ 940 $ 880 $ 2,000 $1,680 INCOME STATEMENTS - Baker Fruit Drinks - Years Ending December 31 (in millions of dollars) 2017 2016 Net sales $3,000.0 $2,850.0 COGS $1,000.0 $1,000.0 Gross Margin $2,000.0 $1,850.0 Oper costs except depr'n & amort. 1,616.2 1,497.0 Depreciation and amortization 100.0 90.0 Operating income (EBIT) $ 283.8 $ 263.0 Less interest 88.0 60.0 Earnings before taxes (EBT) $195.8 $ 203.0 Taxes 78.3 81.2 Net income $ 117.5 $ 121.8 EBITDA Calculation Net Income Interest Taxes Depreciation/Amortization EBITDA SECTIONS 4-1 TO 4-6, RATIO ANALYSIS 2017 2016 Ind Avg 4.20 2.20 Liquidity ratios Current Ratio Quick Ratio Asset Management ratios Inventory Turnover Days Sales Outstanding Debt Management ratios Debt to EBITDA 10.90 36.00 Bank Not Required Profitability ratios Gross Margin % EBITDA Margin% Operating Margin Profit Margin Return on Equity Market Value ratios EBITDA Multiple @ 5X 50% 15% 10% 5% 15% 5.00 C28 A F H K L L M M N N o R S T U - fx INCOME STATEMENTS - Baker Fruit Drinks - Years Ending December 31 B D E G 04 Chapter model V w 1 2 3 4 5 5 6 7 COMPARATIVE SIZE BALANCE SHEETS - Baker Fruit Drinks- December 31 (in millions of dollars) 2017 2016 8 9 Assets Cash and equivalents Accounts receivable Inventories Total current assets Net plant and equipment Other LT assets Total assets $ 10 $ 375 615 $ 1,000 $ 1,600 80 315 415 810 870 10 11 12 13 14 15 16 17 18 $ 2,600 $ 1,680 19 20 21 22 23 24 25 28 Liabilities and equity Accounts payable Notes payable Accruals Total current liabilities Long-term bonds Total debt Common stock (50M shares) Retained earnings Total common equity Total liabilities and equity $ 60 $ 30 110 60 140 130 $ 310 $ 220 750 580 $ 1,060 $ 800 130 130 810 750 $ 940 $ 880 $ 2,000 $1,680 INCOME STATEMENTS - Baker Fruit Drinks - Years Ending December 31 (in millions of dollars) 2017 2016 Net sales $3,000.0 $2,850.0 COGS $1,000.0 $1,000.0 Gross Margin $2,000.0 $1,850.0 Oper costs except depr'n & amort. 1,616.2 1,497.0 Depreciation and amortization 100.0 90.0 Operating income (EBIT) $ 283.8 $ 263.0 Less interest 88.0 60.0 Earnings before taxes (EBT) $195.8 $ 203.0 Taxes 78.3 81.2 Net income $ 117.5 $ 121.8 EBITDA Calculation Net Income Interest Taxes Depreciation/Amortization EBITDA SECTIONS 4-1 TO 4-6, RATIO ANALYSIS 2017 2016 Ind Avg 4.20 2.20 Liquidity ratios Current Ratio Quick Ratio Asset Management ratios Inventory Turnover Days Sales Outstanding Debt Management ratios Debt to EBITDA 10.90 36.00 Bank Not Required Profitability ratios Gross Margin % EBITDA Margin% Operating Margin Profit Margin Return on Equity Market Value ratios EBITDA Multiple @ 5X 50% 15% 10% 5% 15% 5.00