

Answered step by step
Verified Expert Solution
Question
1 Approved Answer
Please answer the Part 3 and fill the green cell with excel formula. Thank you A B D E F G H I J K
Please answer the Part 3 and fill the green cell with excel formula.
Thank you
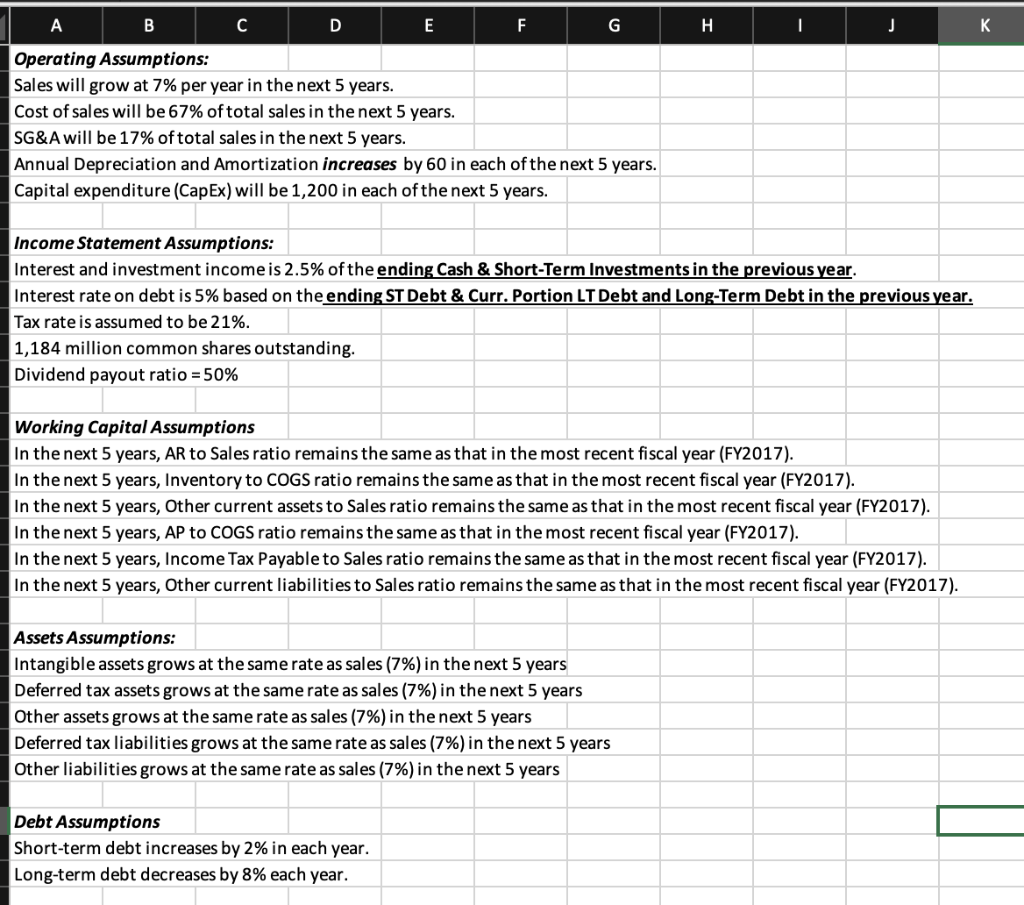
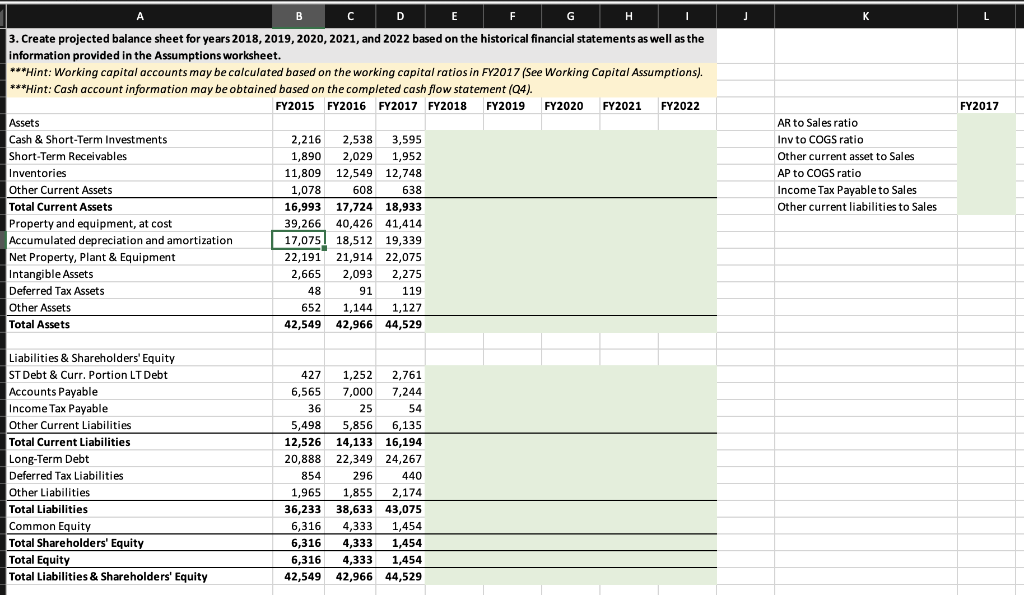
A B D E F G H I J K Operating Assumptions: Sales will grow at 7% per year in the next 5 years. Cost of sales will be 67% of total sales in the next 5 years. SG&A will be 17% of total sales in the next 5 years. Annual Depreciation and Amortization increases by 60 in each of the next 5 years. Capital expenditure (CapEx) will be 1,200 in each of the next 5 years. Income Statement Assumptions: Interest and investment income is 2.5% of the ending Cash & Short-Term Investments in the previous year. Interest rate on debt is 5% based on the ending ST Debt & Curr. Portion LT Debt and Long-Term Debt in the previous year. Tax rate is assumed to be 21%. 1,184 million common shares outstanding. Dividend payout ratio = 50% Working Capital Assumptions In the next 5 years, AR to Sales ratio remains the same as that in the most recent fiscal year (FY2017). In the next 5 years, Inventory to COGS ratio remains the same as that in the most recent fiscal year (FY2017). In the next 5 years, Other current assets to Sales ratio remains the same as that in the most recent fiscal year (FY2017). In the next 5 years, AP to COGS ratio remains the same as that in the most recent fiscal year (FY2017). In the next 5 years, Income Tax Payable to Sales ratio remains the same as that in the most recent fiscal year (FY2017). In the next 5 years, Other current liabilities to Sales ratio remains the same as that in the most recent fiscal year (FY2017). Assets Assumptions: Intangible assets grows at the same rate as sales (7%) in the next 5 years Deferred tax assets grows at the same rate as sales (7%) in the next 5 years Other assets grows at the same rate as sales (7%) in the next 5 years Deferred tax liabilities grows at the same rate as sales (7%) in the next 5 years Other liabilities grows at the same rate as sales (7%) in the next 5 years Debt Assumptions Short-term debt increases by 2% in each year. Long-term debt decreases by 8% each year. J K L FY2017 B C D F F G H 3. Create projected balance sheet for years 2018, 2019, 2020, 2021, and 2022 based on the historical financial statements as well as the information provided in the Assumptions worksheet. ***Hint: Working capital accounts may be calculated based on the working capital ratios in FY2017 (See Working Capital Assumptions). ***Hint: Cash account information may be obtained based on the completed cash flow statement (Q4). FY2015 FY2016 FY2017 FY2018 FY2019 FY2020 FY2021 FY2022 Assets Cash & Short-Term Investments & 2,216 2,538 3,595 Short-Term Receivables 1,890 2,029 1,952 Inventories 11,809 12,549 12,748 Other Current Assets 1,078 608 638 Total Current Assets 16.993 17,724 18,933 Property and equipment, at cost 39,266 40,426 41,414 Accumulated depreciation and amortization 17,075 18,512 19,339 Net Property, Plant & Equipment 22,191 21,914 22,075 Intangible Assets 2,665 2,093 2,275 Deferred Tax Assets 48 91 119 Other Assets 652 1.144 1,127 Total Assets 42,549 42,966 44,529 AR to Sales ratio Inv to COGS ratio Other current asset to Sales AP to COGS ratio Income Tax Payable to Sales Other current liabilities to Sales Liabilities & Shareholders' Equity ST Debt & Curr. Portion LT Debt Accounts Payable Income Tax Payable Other Current Liabilities Total Current Liabilities Long-Term Debt Deferred Tax Liabilities Other Liabilities Total Liabilities Common Equity Total Shareholders' Equity Total Equity Total Liabilities & Shareholders' Equity 427 1,252 2,761 6,565 7,000 7,244 36 25 54 5,498 5,856 6,135 12,526 14,133 16,194 20,888 22,349 24,267 854 296 440 1,965 1,855 2,174 36,233 38,633 43,075 6,316 4,333 1,454 6,316 4,333 1,454 6,316 4,333 1,454 42,549 42,966 44,529 A B D E F G H I J K Operating Assumptions: Sales will grow at 7% per year in the next 5 years. Cost of sales will be 67% of total sales in the next 5 years. SG&A will be 17% of total sales in the next 5 years. Annual Depreciation and Amortization increases by 60 in each of the next 5 years. Capital expenditure (CapEx) will be 1,200 in each of the next 5 years. Income Statement Assumptions: Interest and investment income is 2.5% of the ending Cash & Short-Term Investments in the previous year. Interest rate on debt is 5% based on the ending ST Debt & Curr. Portion LT Debt and Long-Term Debt in the previous year. Tax rate is assumed to be 21%. 1,184 million common shares outstanding. Dividend payout ratio = 50% Working Capital Assumptions In the next 5 years, AR to Sales ratio remains the same as that in the most recent fiscal year (FY2017). In the next 5 years, Inventory to COGS ratio remains the same as that in the most recent fiscal year (FY2017). In the next 5 years, Other current assets to Sales ratio remains the same as that in the most recent fiscal year (FY2017). In the next 5 years, AP to COGS ratio remains the same as that in the most recent fiscal year (FY2017). In the next 5 years, Income Tax Payable to Sales ratio remains the same as that in the most recent fiscal year (FY2017). In the next 5 years, Other current liabilities to Sales ratio remains the same as that in the most recent fiscal year (FY2017). Assets Assumptions: Intangible assets grows at the same rate as sales (7%) in the next 5 years Deferred tax assets grows at the same rate as sales (7%) in the next 5 years Other assets grows at the same rate as sales (7%) in the next 5 years Deferred tax liabilities grows at the same rate as sales (7%) in the next 5 years Other liabilities grows at the same rate as sales (7%) in the next 5 years Debt Assumptions Short-term debt increases by 2% in each year. Long-term debt decreases by 8% each year. J K L FY2017 B C D F F G H 3. Create projected balance sheet for years 2018, 2019, 2020, 2021, and 2022 based on the historical financial statements as well as the information provided in the Assumptions worksheet. ***Hint: Working capital accounts may be calculated based on the working capital ratios in FY2017 (See Working Capital Assumptions). ***Hint: Cash account information may be obtained based on the completed cash flow statement (Q4). FY2015 FY2016 FY2017 FY2018 FY2019 FY2020 FY2021 FY2022 Assets Cash & Short-Term Investments & 2,216 2,538 3,595 Short-Term Receivables 1,890 2,029 1,952 Inventories 11,809 12,549 12,748 Other Current Assets 1,078 608 638 Total Current Assets 16.993 17,724 18,933 Property and equipment, at cost 39,266 40,426 41,414 Accumulated depreciation and amortization 17,075 18,512 19,339 Net Property, Plant & Equipment 22,191 21,914 22,075 Intangible Assets 2,665 2,093 2,275 Deferred Tax Assets 48 91 119 Other Assets 652 1.144 1,127 Total Assets 42,549 42,966 44,529 AR to Sales ratio Inv to COGS ratio Other current asset to Sales AP to COGS ratio Income Tax Payable to Sales Other current liabilities to Sales Liabilities & Shareholders' Equity ST Debt & Curr. Portion LT Debt Accounts Payable Income Tax Payable Other Current Liabilities Total Current Liabilities Long-Term Debt Deferred Tax Liabilities Other Liabilities Total Liabilities Common Equity Total Shareholders' Equity Total Equity Total Liabilities & Shareholders' Equity 427 1,252 2,761 6,565 7,000 7,244 36 25 54 5,498 5,856 6,135 12,526 14,133 16,194 20,888 22,349 24,267 854 296 440 1,965 1,855 2,174 36,233 38,633 43,075 6,316 4,333 1,454 6,316 4,333 1,454 6,316 4,333 1,454 42,549 42,966 44,529Step by Step Solution
There are 3 Steps involved in it
Step: 1

Get Instant Access to Expert-Tailored Solutions
See step-by-step solutions with expert insights and AI powered tools for academic success
Step: 2

Step: 3
Ace Your Homework with AI
Get the answers you need in no time with our AI-driven, step-by-step assistance
Get Started
Digital Finance Big Data Start-ups And The Future Of Financial Services
Authors: Perry Beaumont
1st Edition
0367146797, 978-0367146795