Answered step by step
Verified Expert Solution
Question
1 Approved Answer
please answer the problems below and try to do the bonus as well. This shows effects of errors caused because computer representations of numbers have
please answer the problems below and try to do the bonus as well.

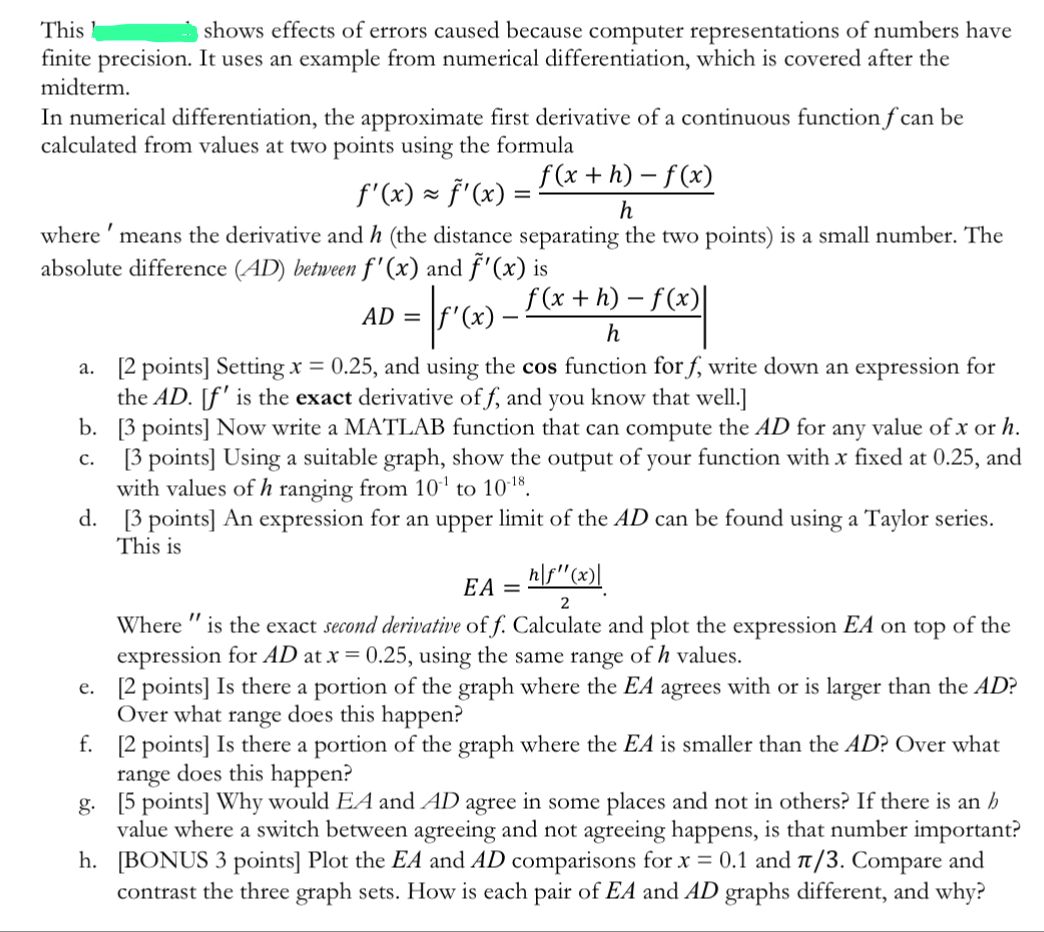
This shows effects of errors caused because computer representations of numbers have finite precision. It uses an example from numerical differentiation, which is covered after the midterm. In numerical differentiation, the approximate first derivative of a continuous function f can be calculated from values at two points using the formula '(x) f'(x): f(x +h)-f(x) h where means the derivative and h (the distance separating the two points) is a small number. The absolute difference (AD) between f'(x) and f'(x) is - = | r(x) _ f (x + h) = f(x)] h " AD = = a. [2 points] Setting x = 0.25, and using the cos function for f, write down an expression for the AD. [f' is the exact derivative of f, and you know that well.] b. [3 points] Now write a MATLAB function that can compute the AD for any value of x or h. [3 points] Using a suitable graph, show the output of your function with x fixed at 0.25, and with values of h ranging from 10 to 10-8. c. d. [3 points] An expression for an upper limit of the AD can be found using a Taylor series. This is h|f"(x)| EA = 2 Where " is the exact second derivative of f. Calculate and plot the expression EA on top of the expression for AD at x = 0.25, using the same range of h values. e. [2 points] Is there a portion of the graph where the EA agrees with or is larger than the AD? Over what range does this happen? f. [2 points] Is there a portion of the graph where the EA is smaller than the AD? Over what range does this happen? g. [5 points] Why would EA and AD agree in some places and not in others? If there is an h value where a switch between agreeing and not agreeing happens, is that number important? h. [BONUS 3 points] Plot the EA and AD comparisons for x = 0.1 and 7/3. Compare and contrast the three graph sets. How is each pair of EA and AD graphs different, and why?
Step by Step Solution
There are 3 Steps involved in it
Step: 1

Get Instant Access to Expert-Tailored Solutions
See step-by-step solutions with expert insights and AI powered tools for academic success
Step: 2

Step: 3

Ace Your Homework with AI
Get the answers you need in no time with our AI-driven, step-by-step assistance
Get Started


