

Question: Please answer the questions below labeling each question in organized manner Assume that you have a sample of n, = 4, with the sample mean
Please answer the questions below labeling each question in organized manner
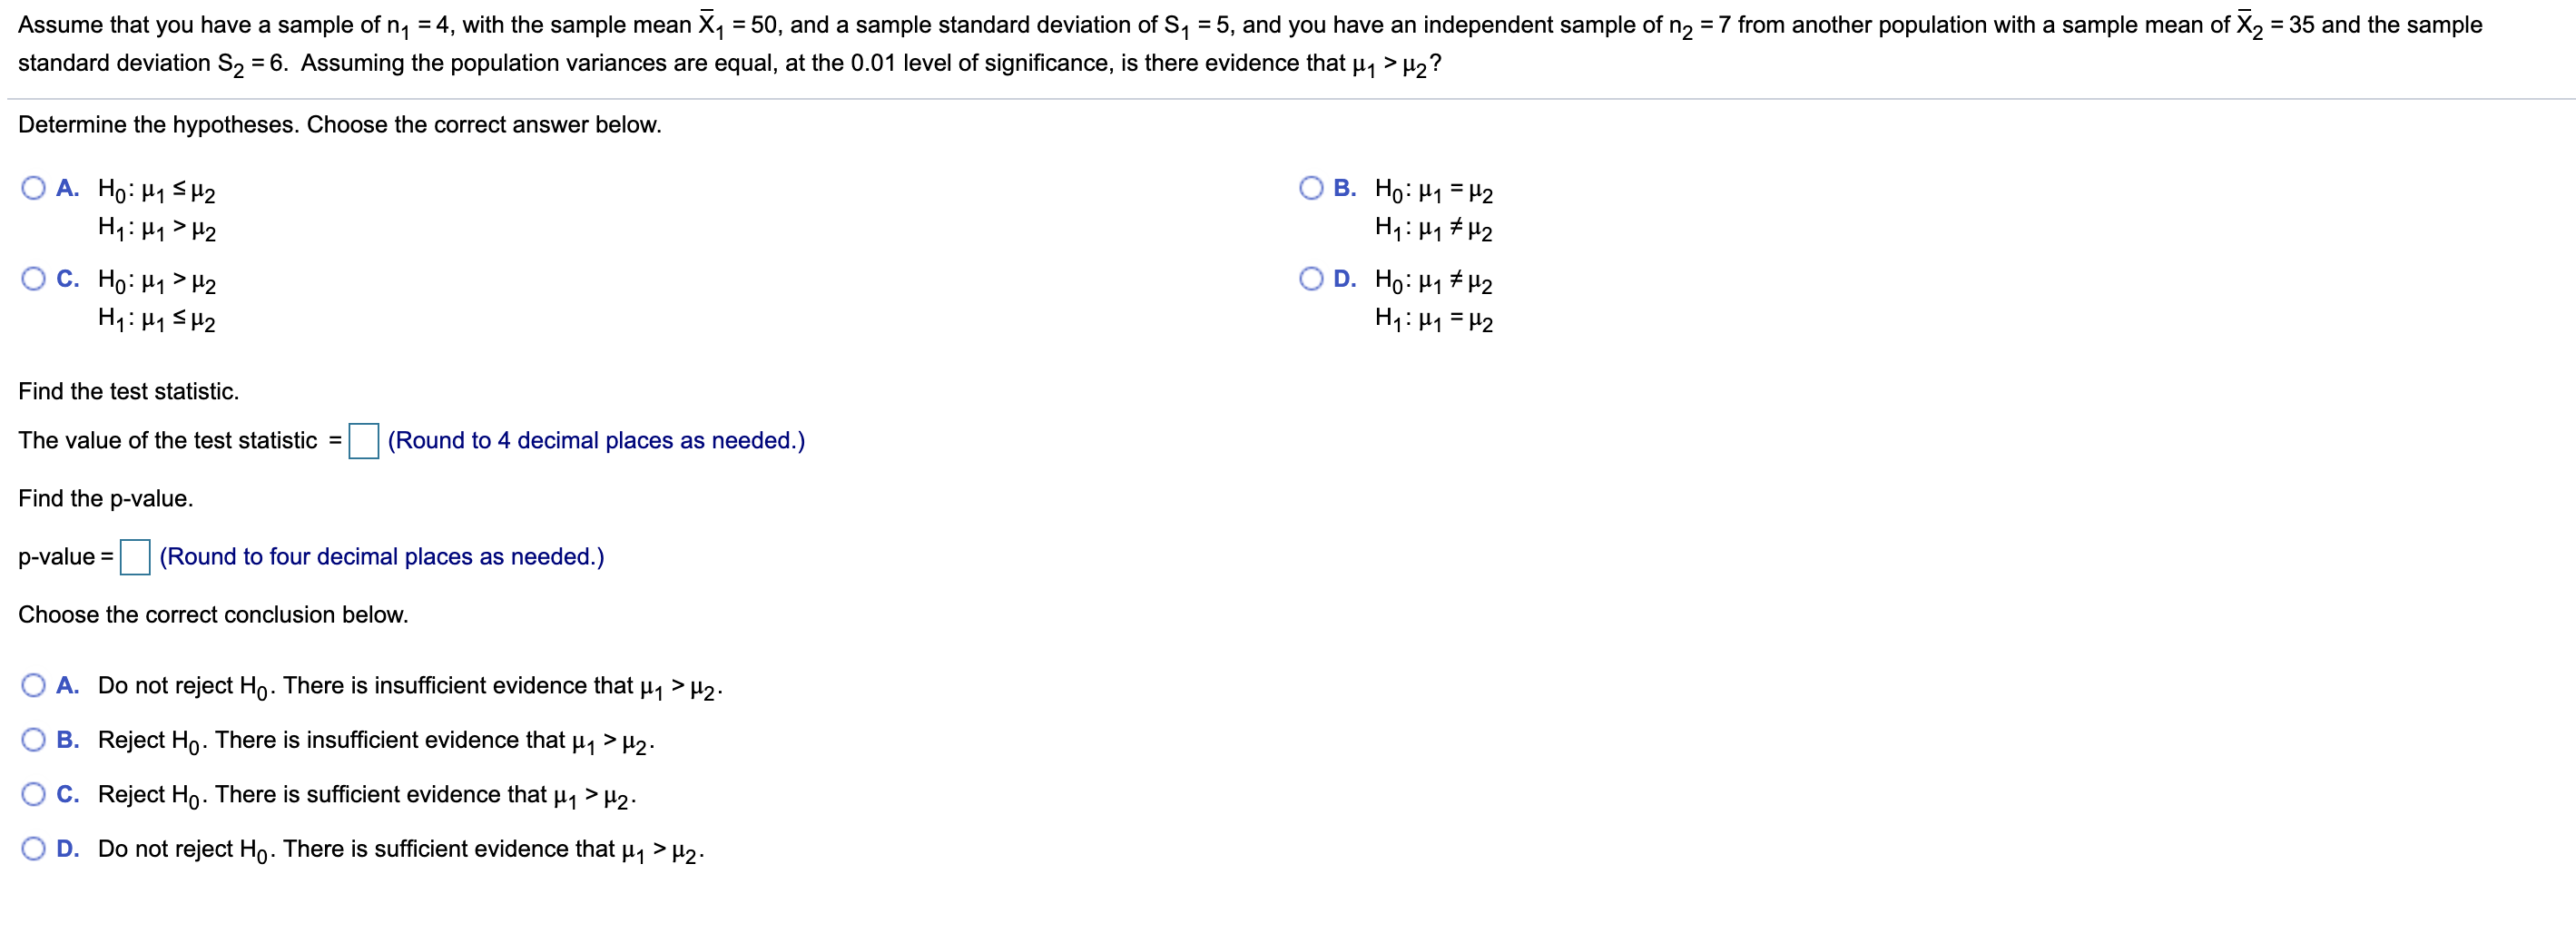
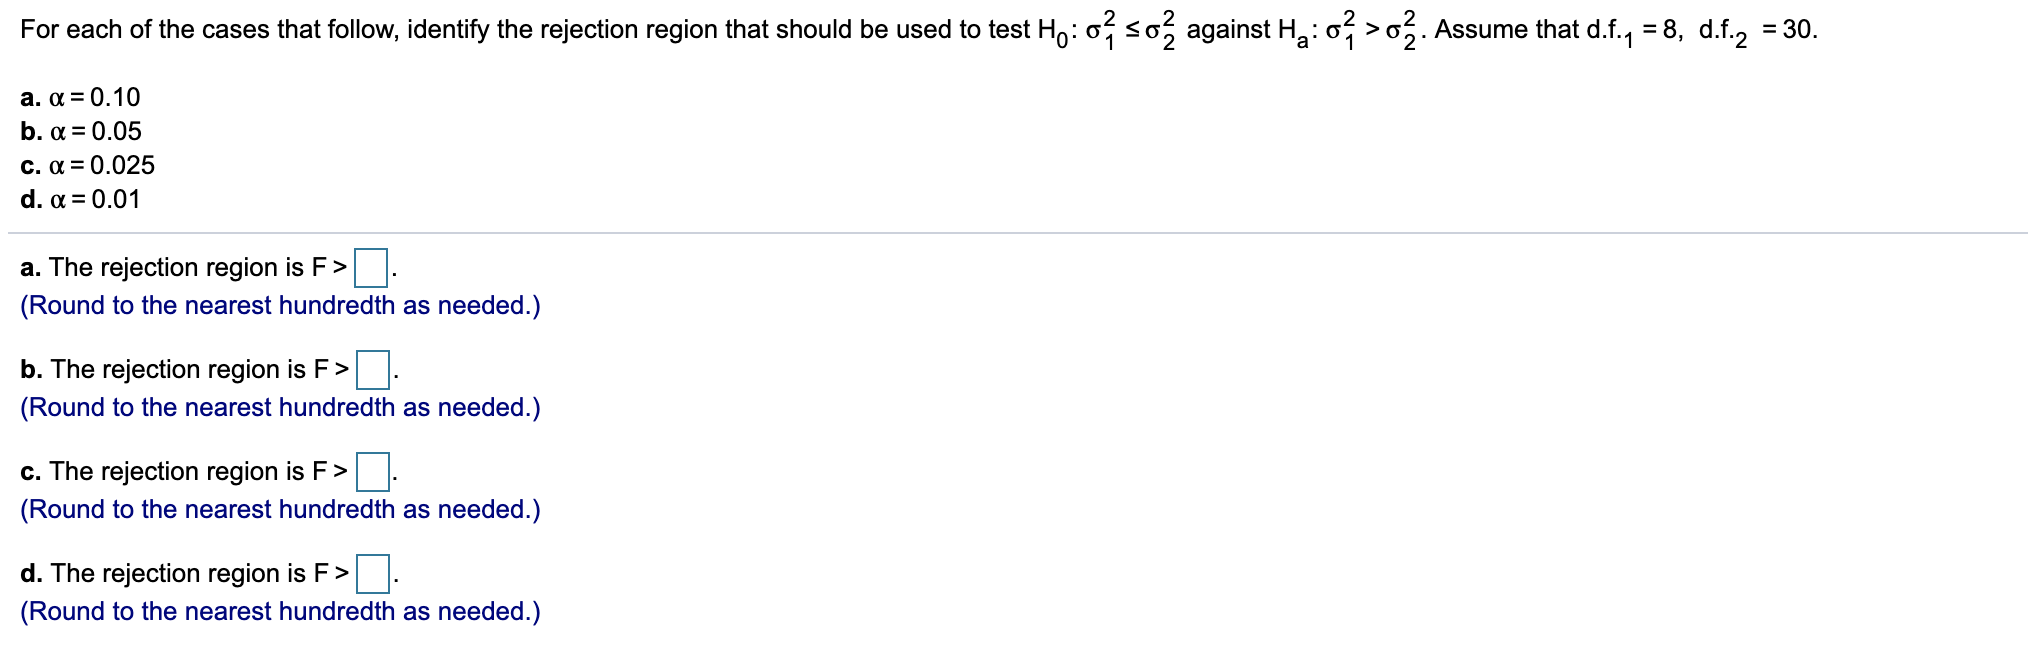
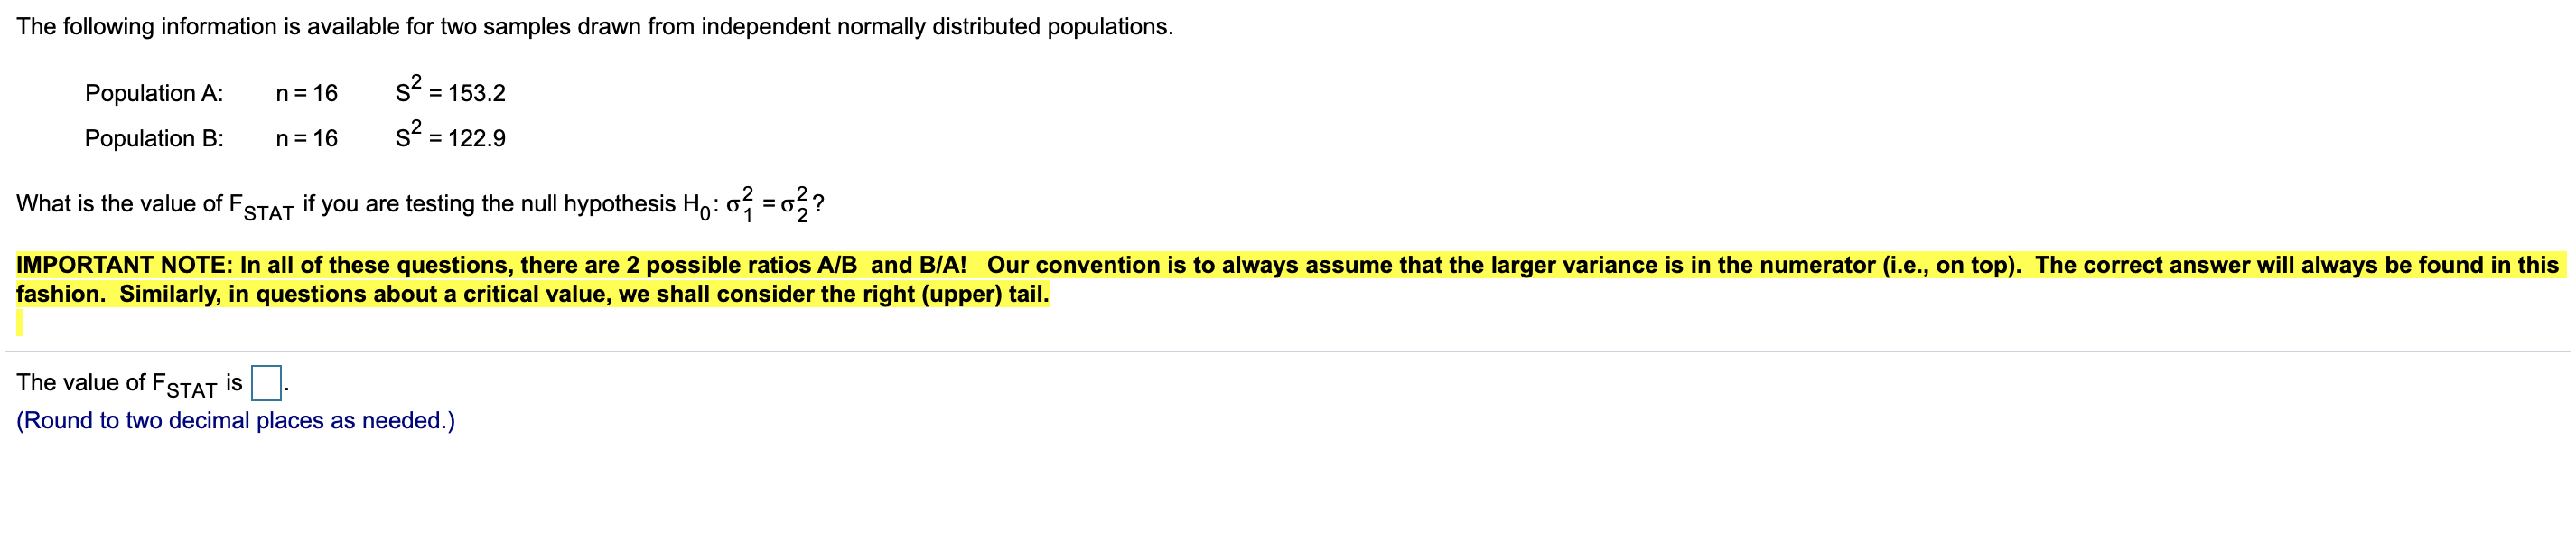
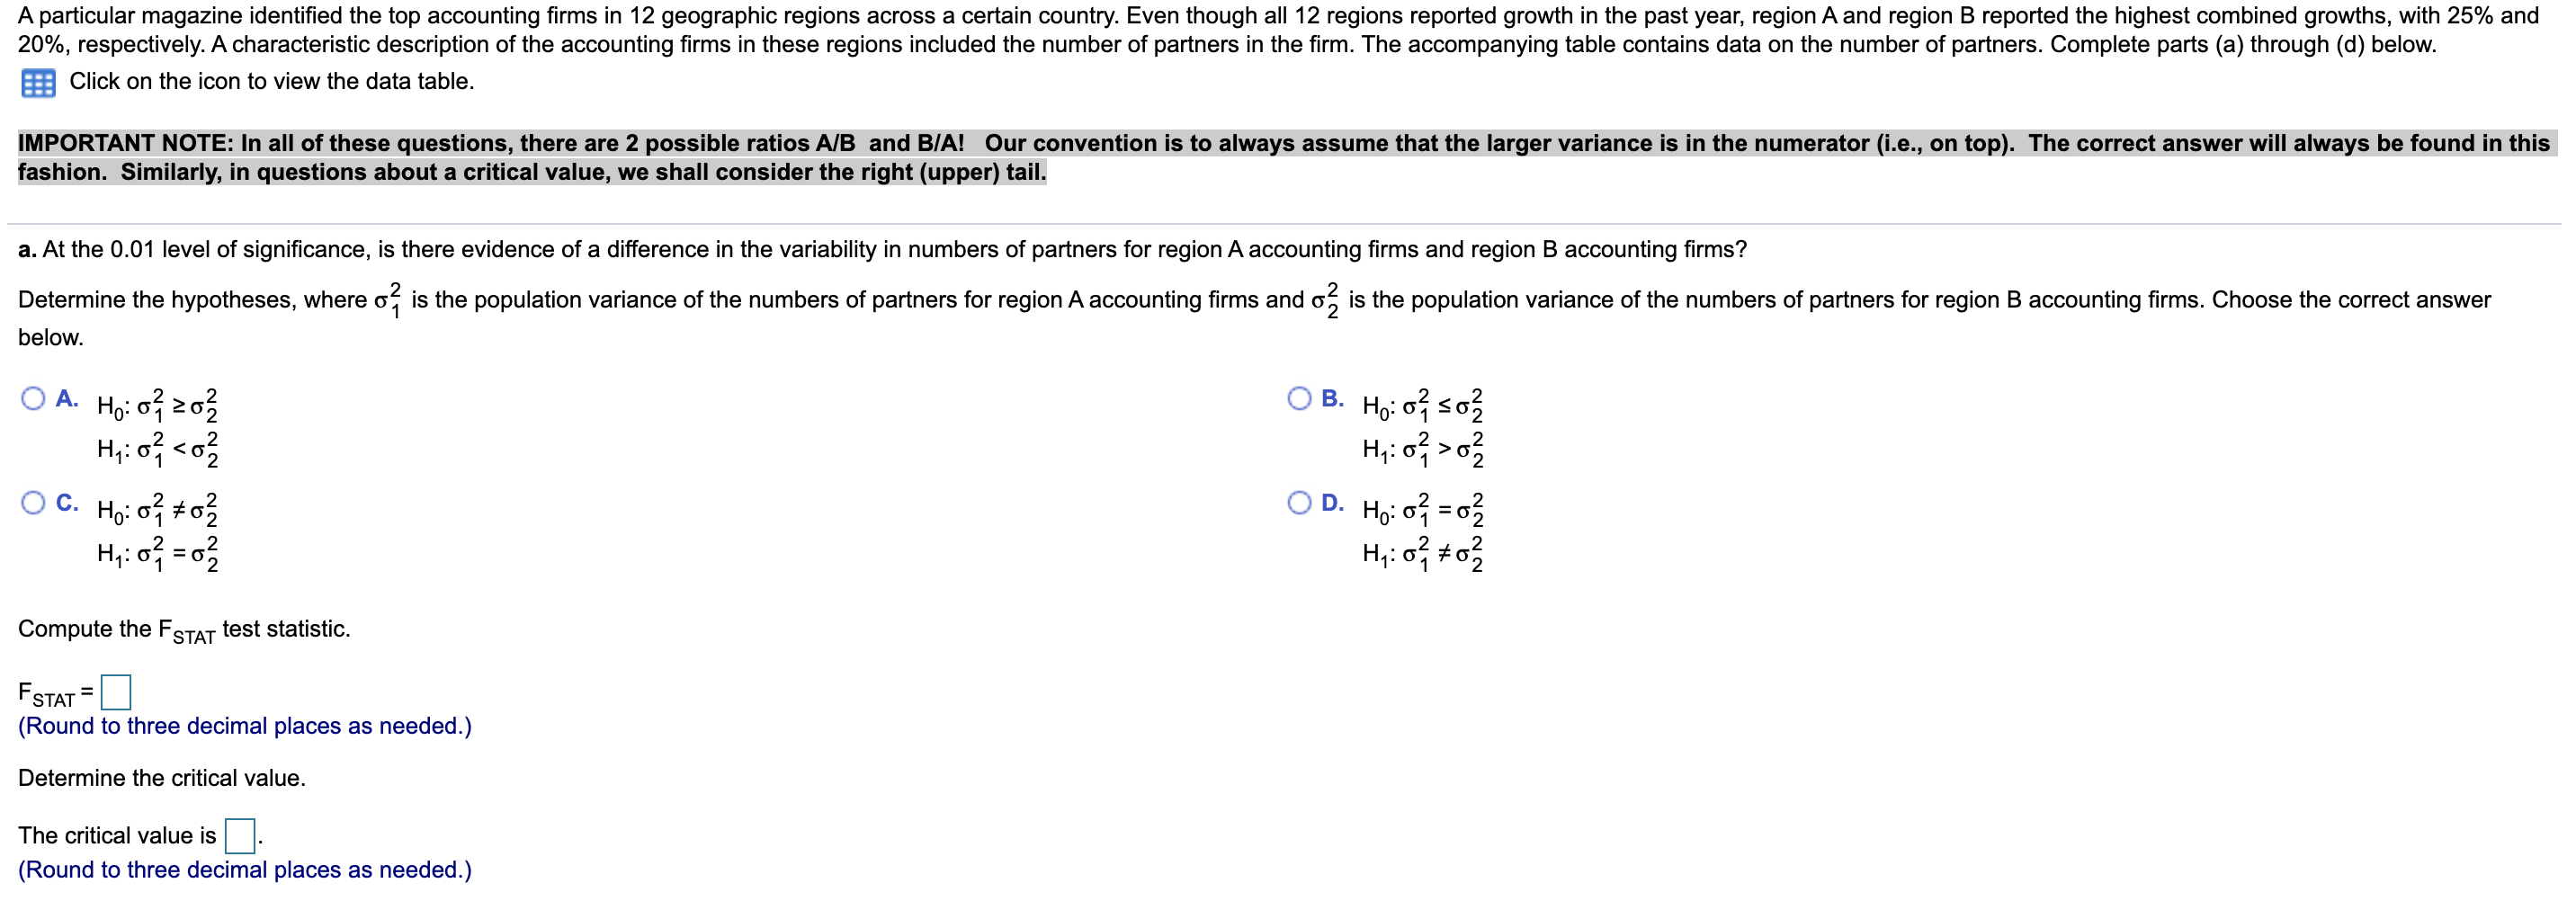
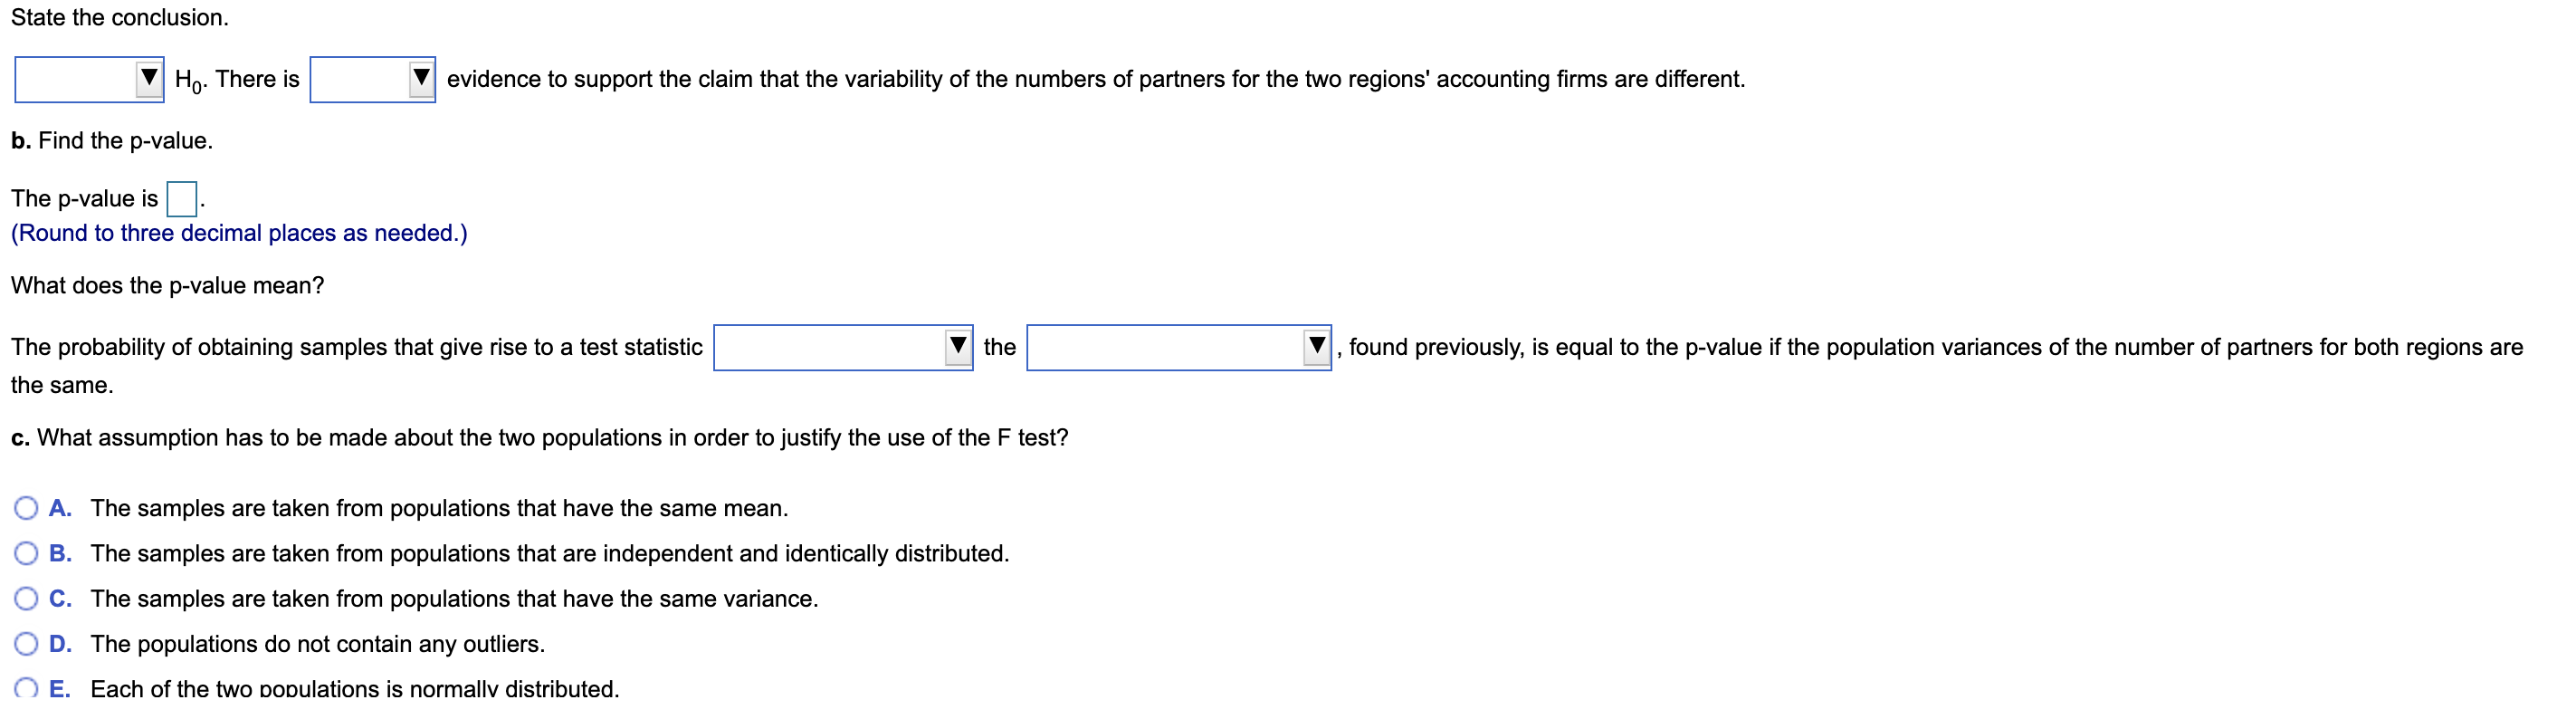
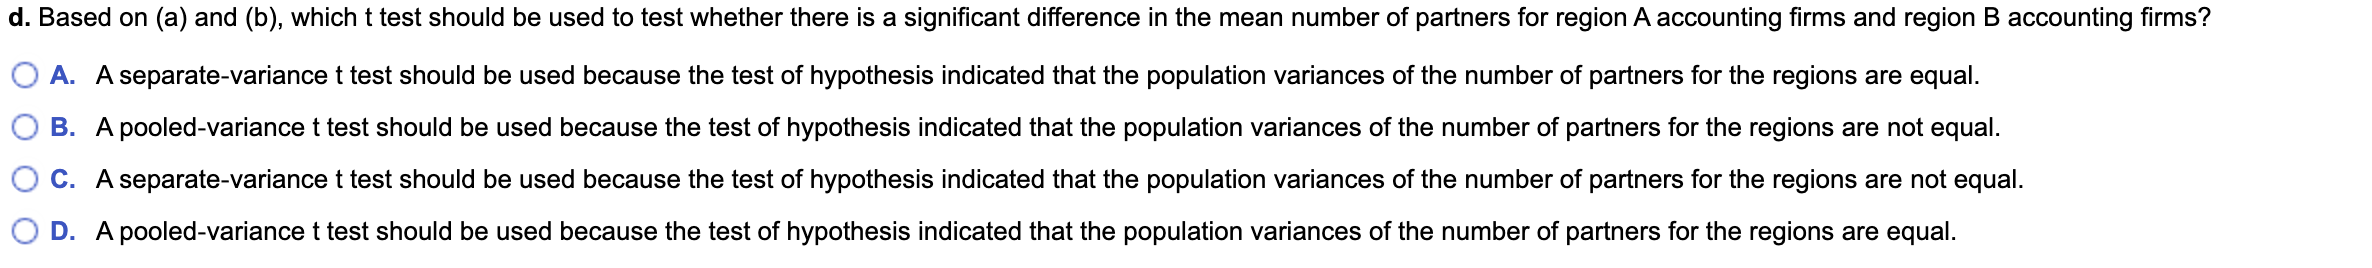
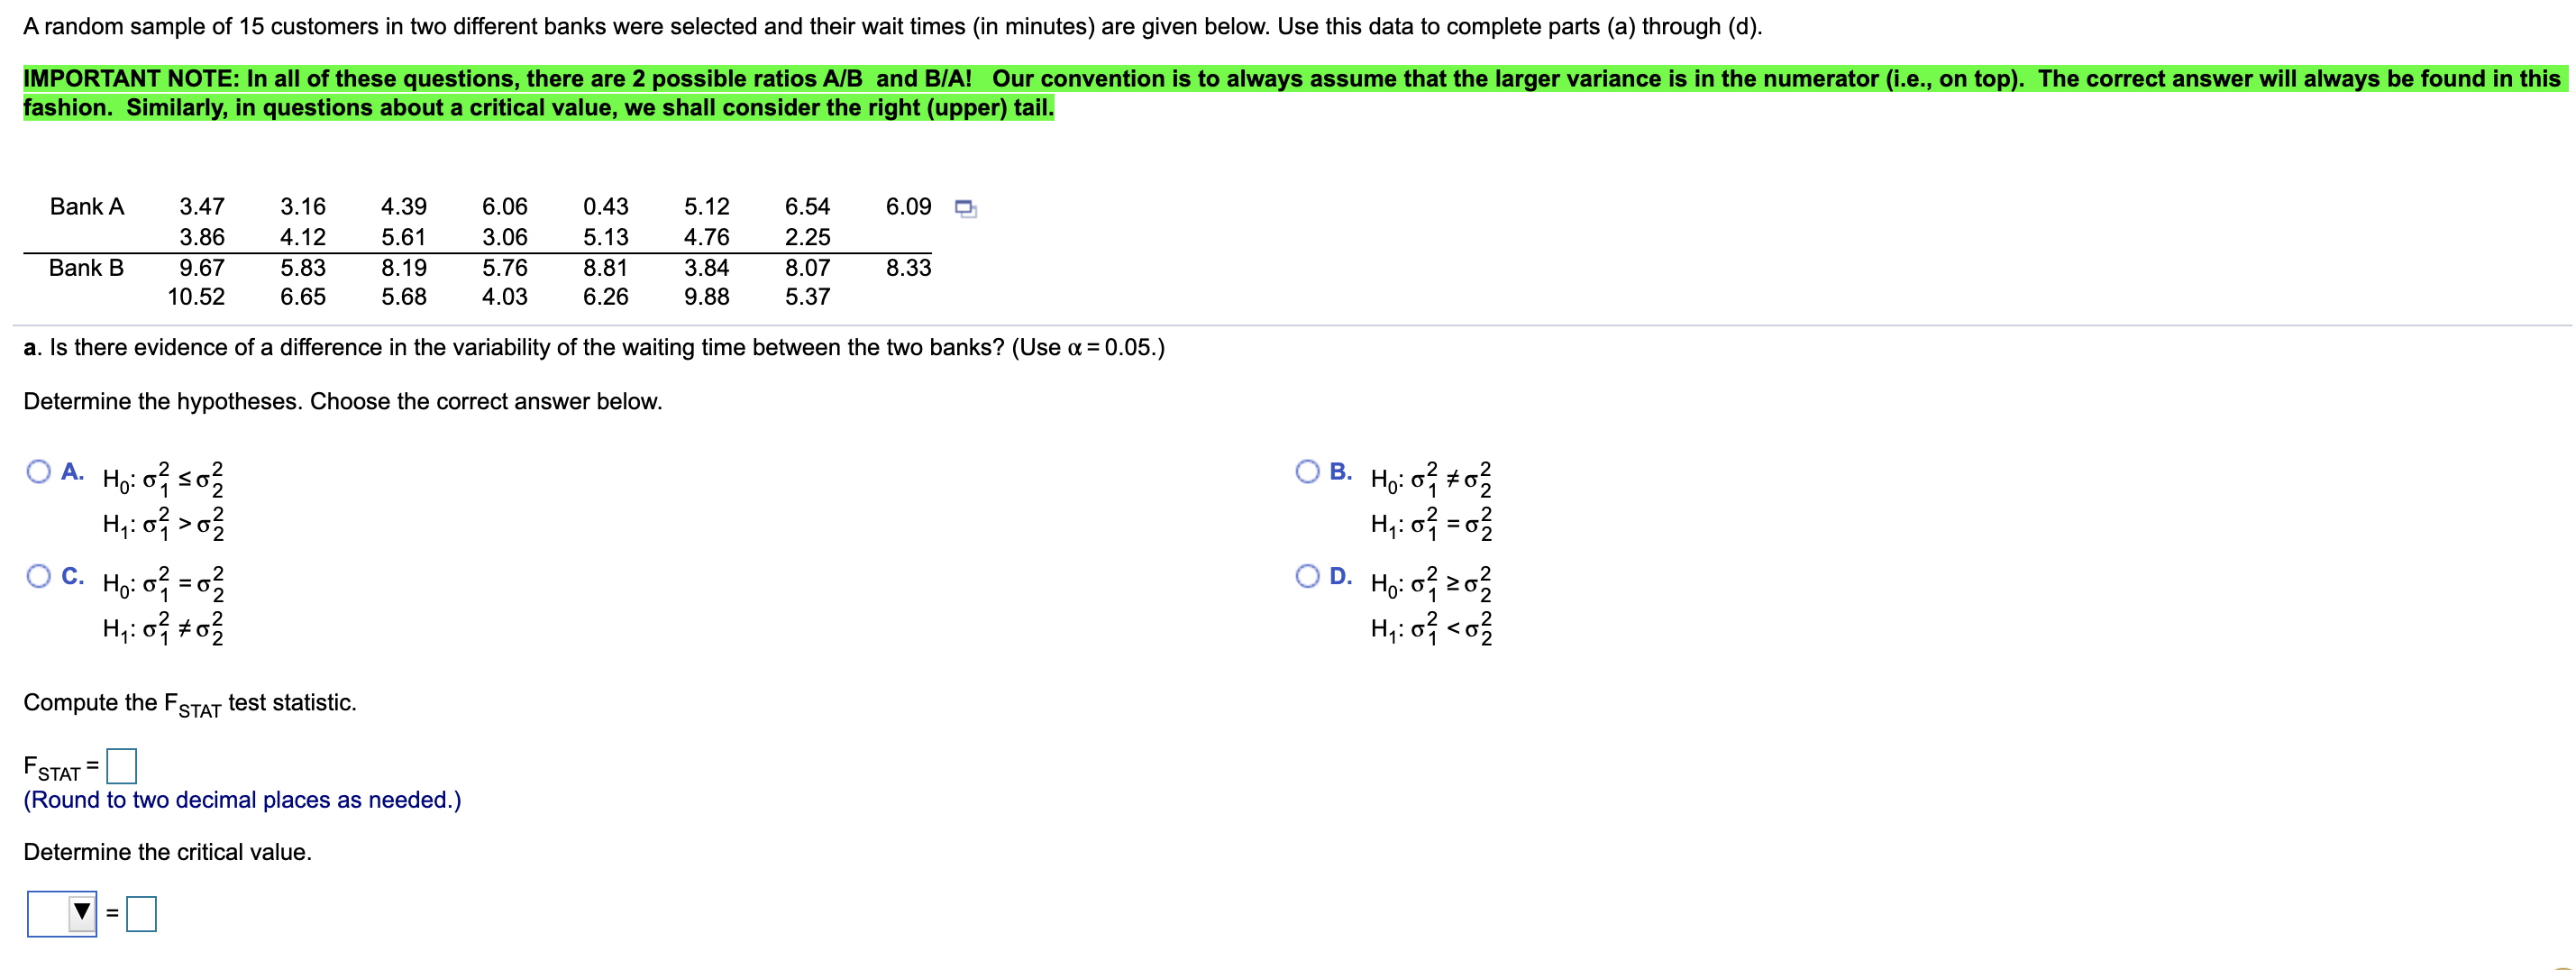
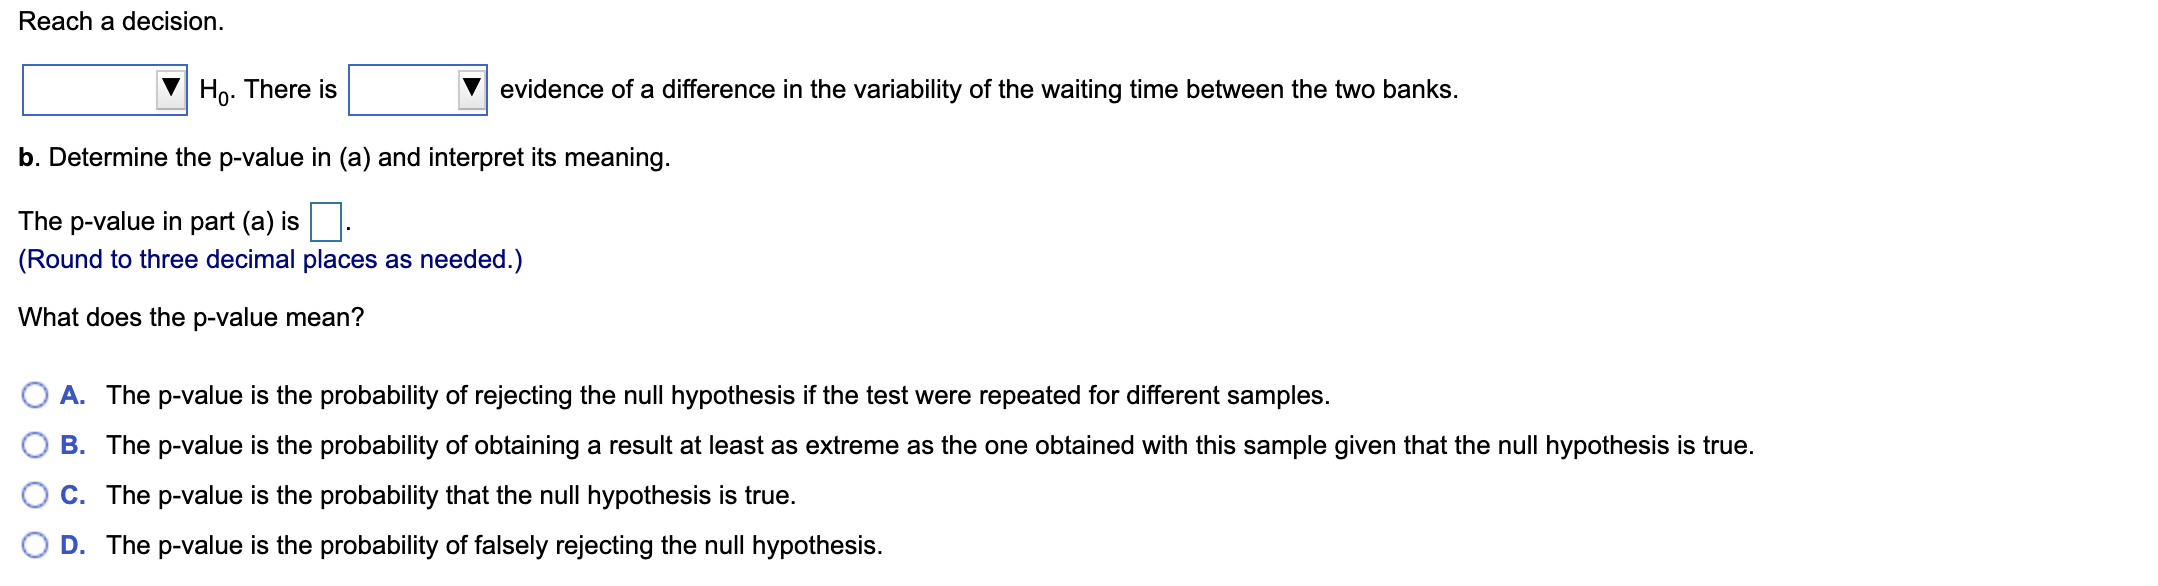
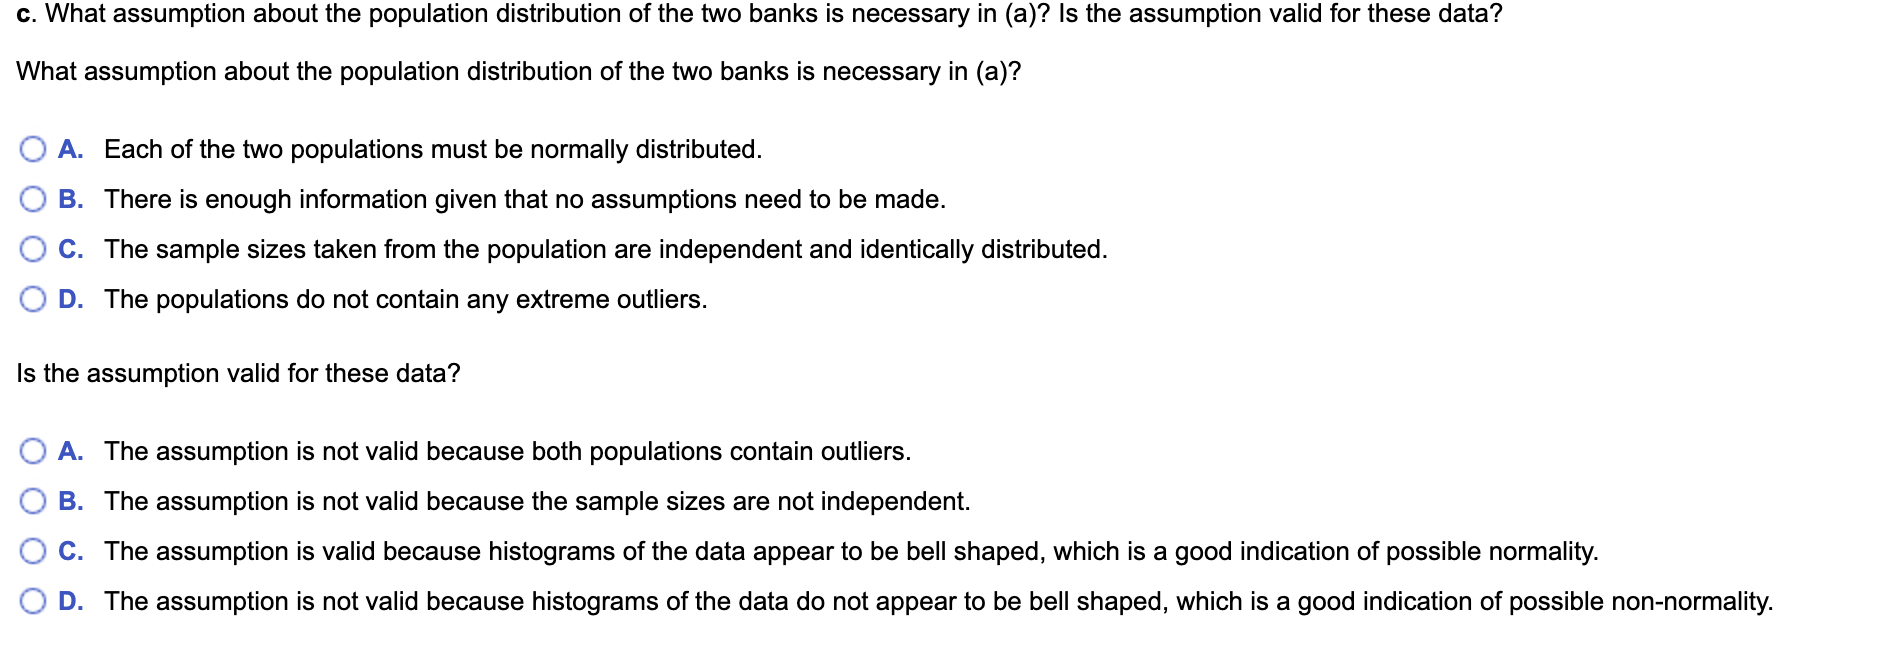
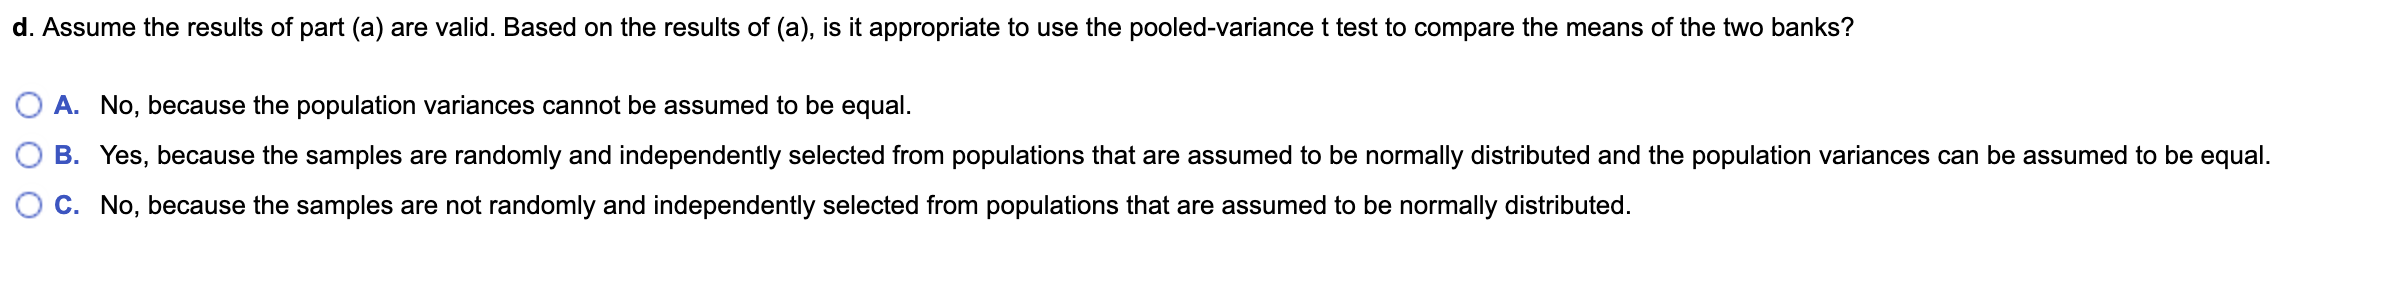
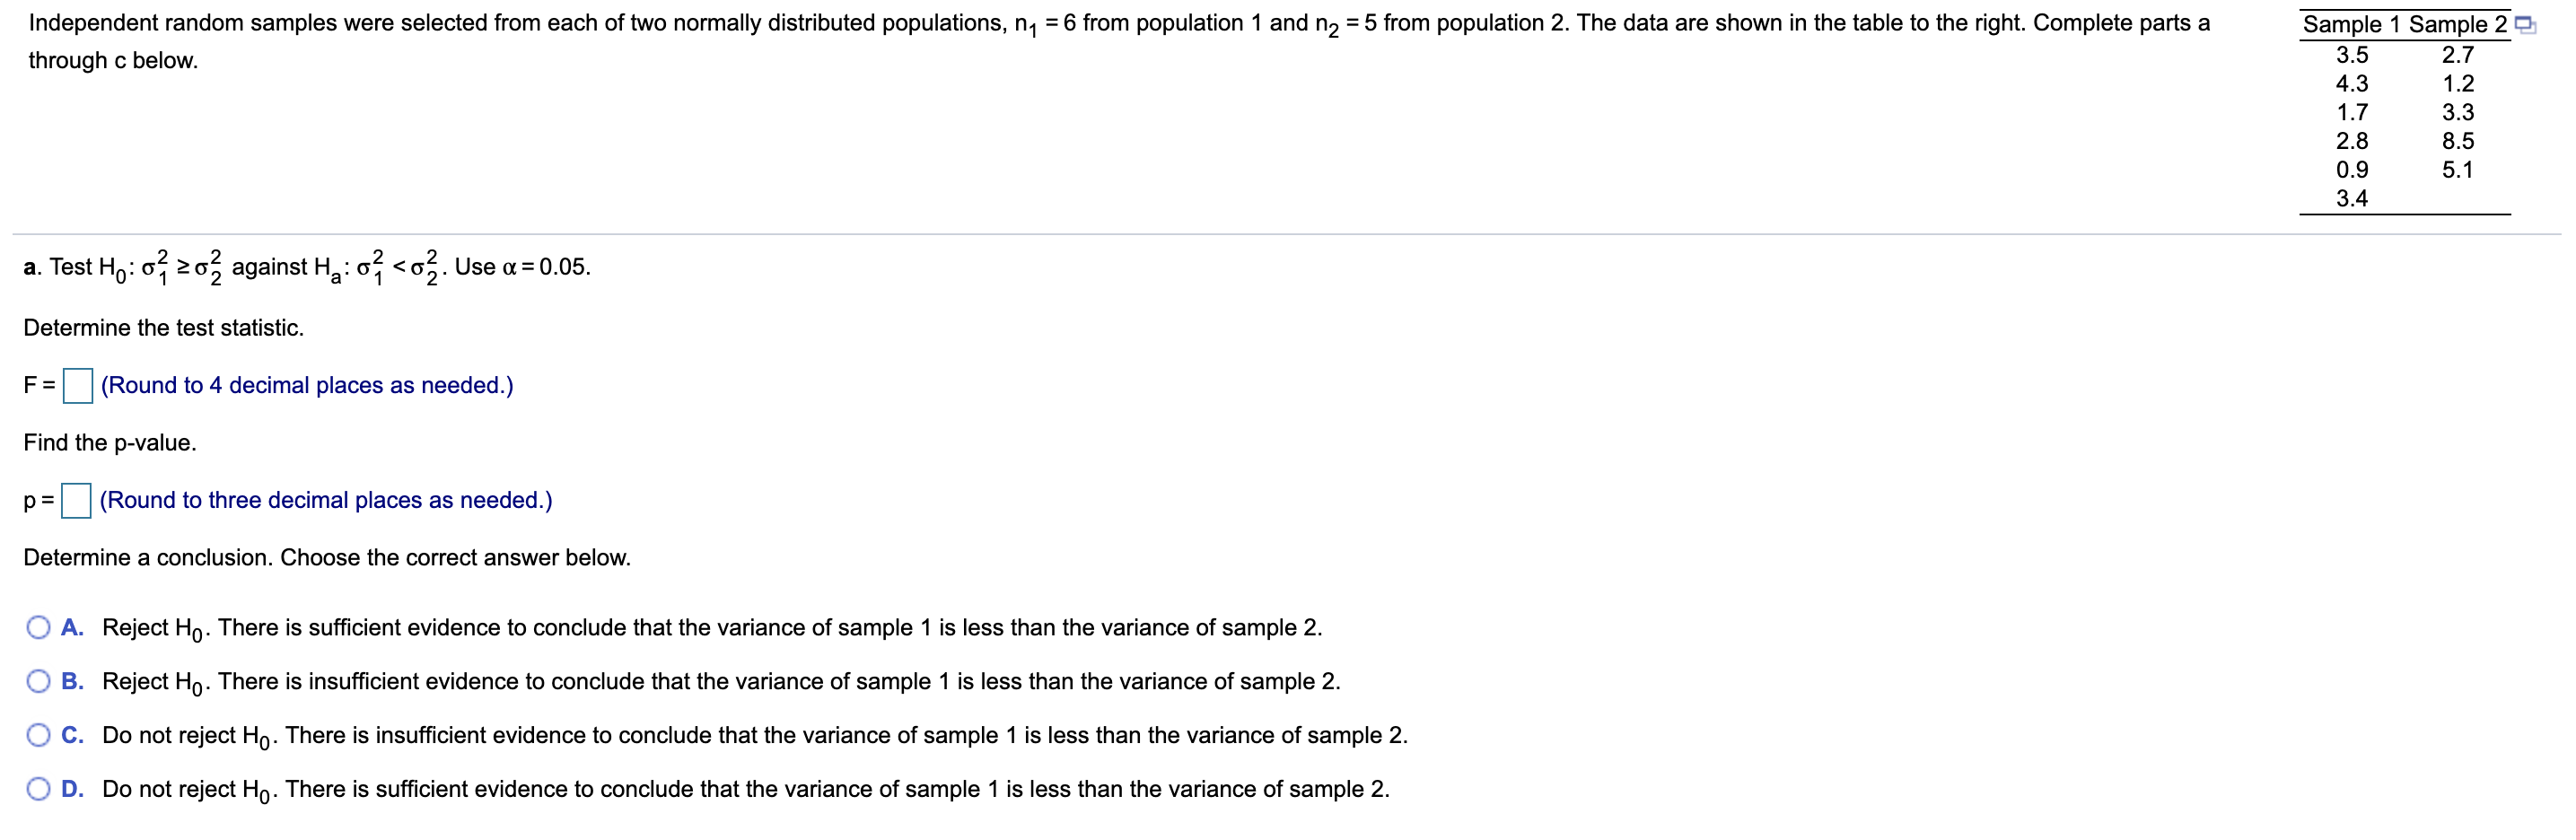
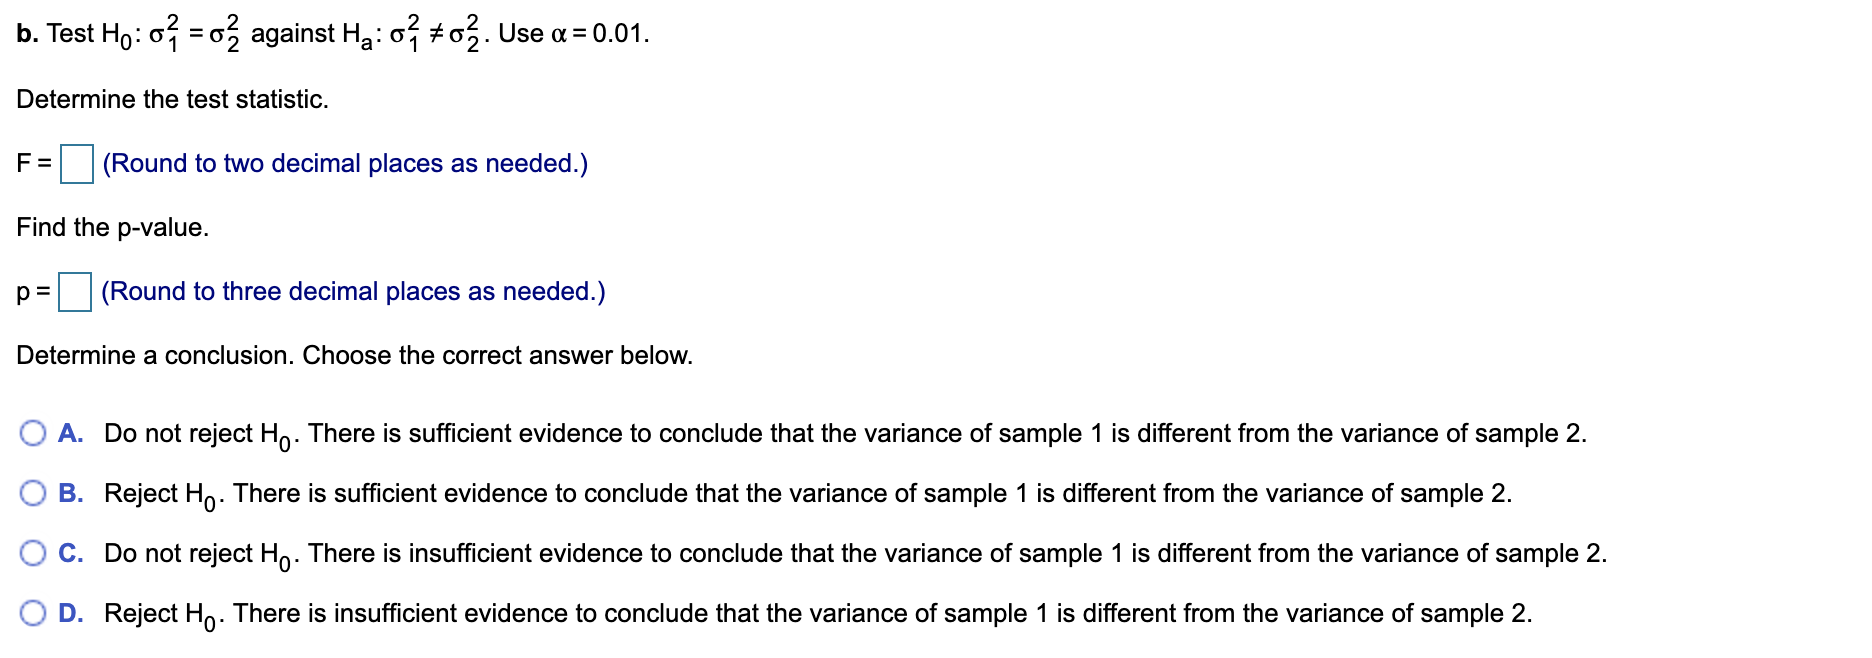
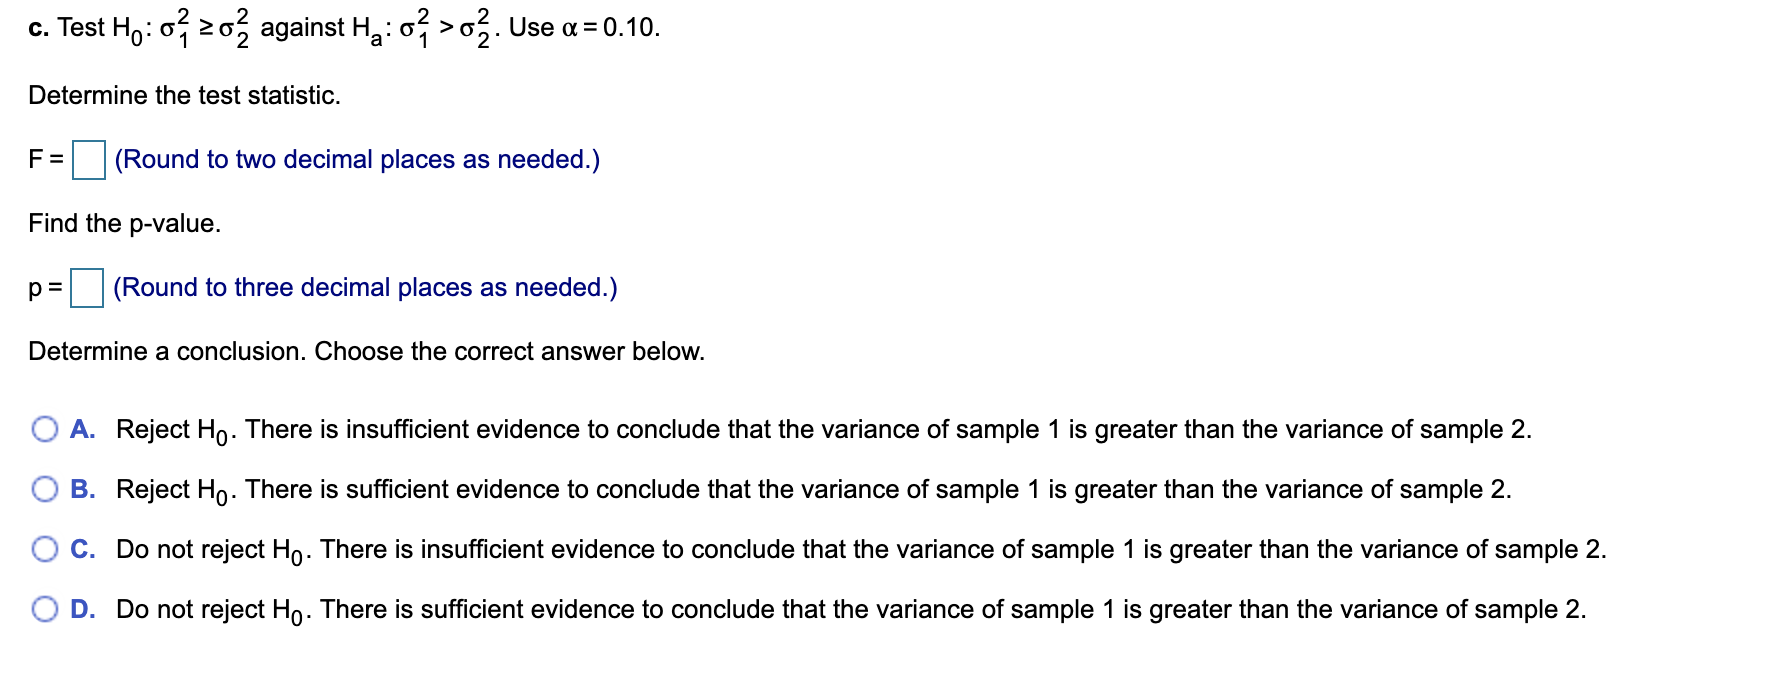
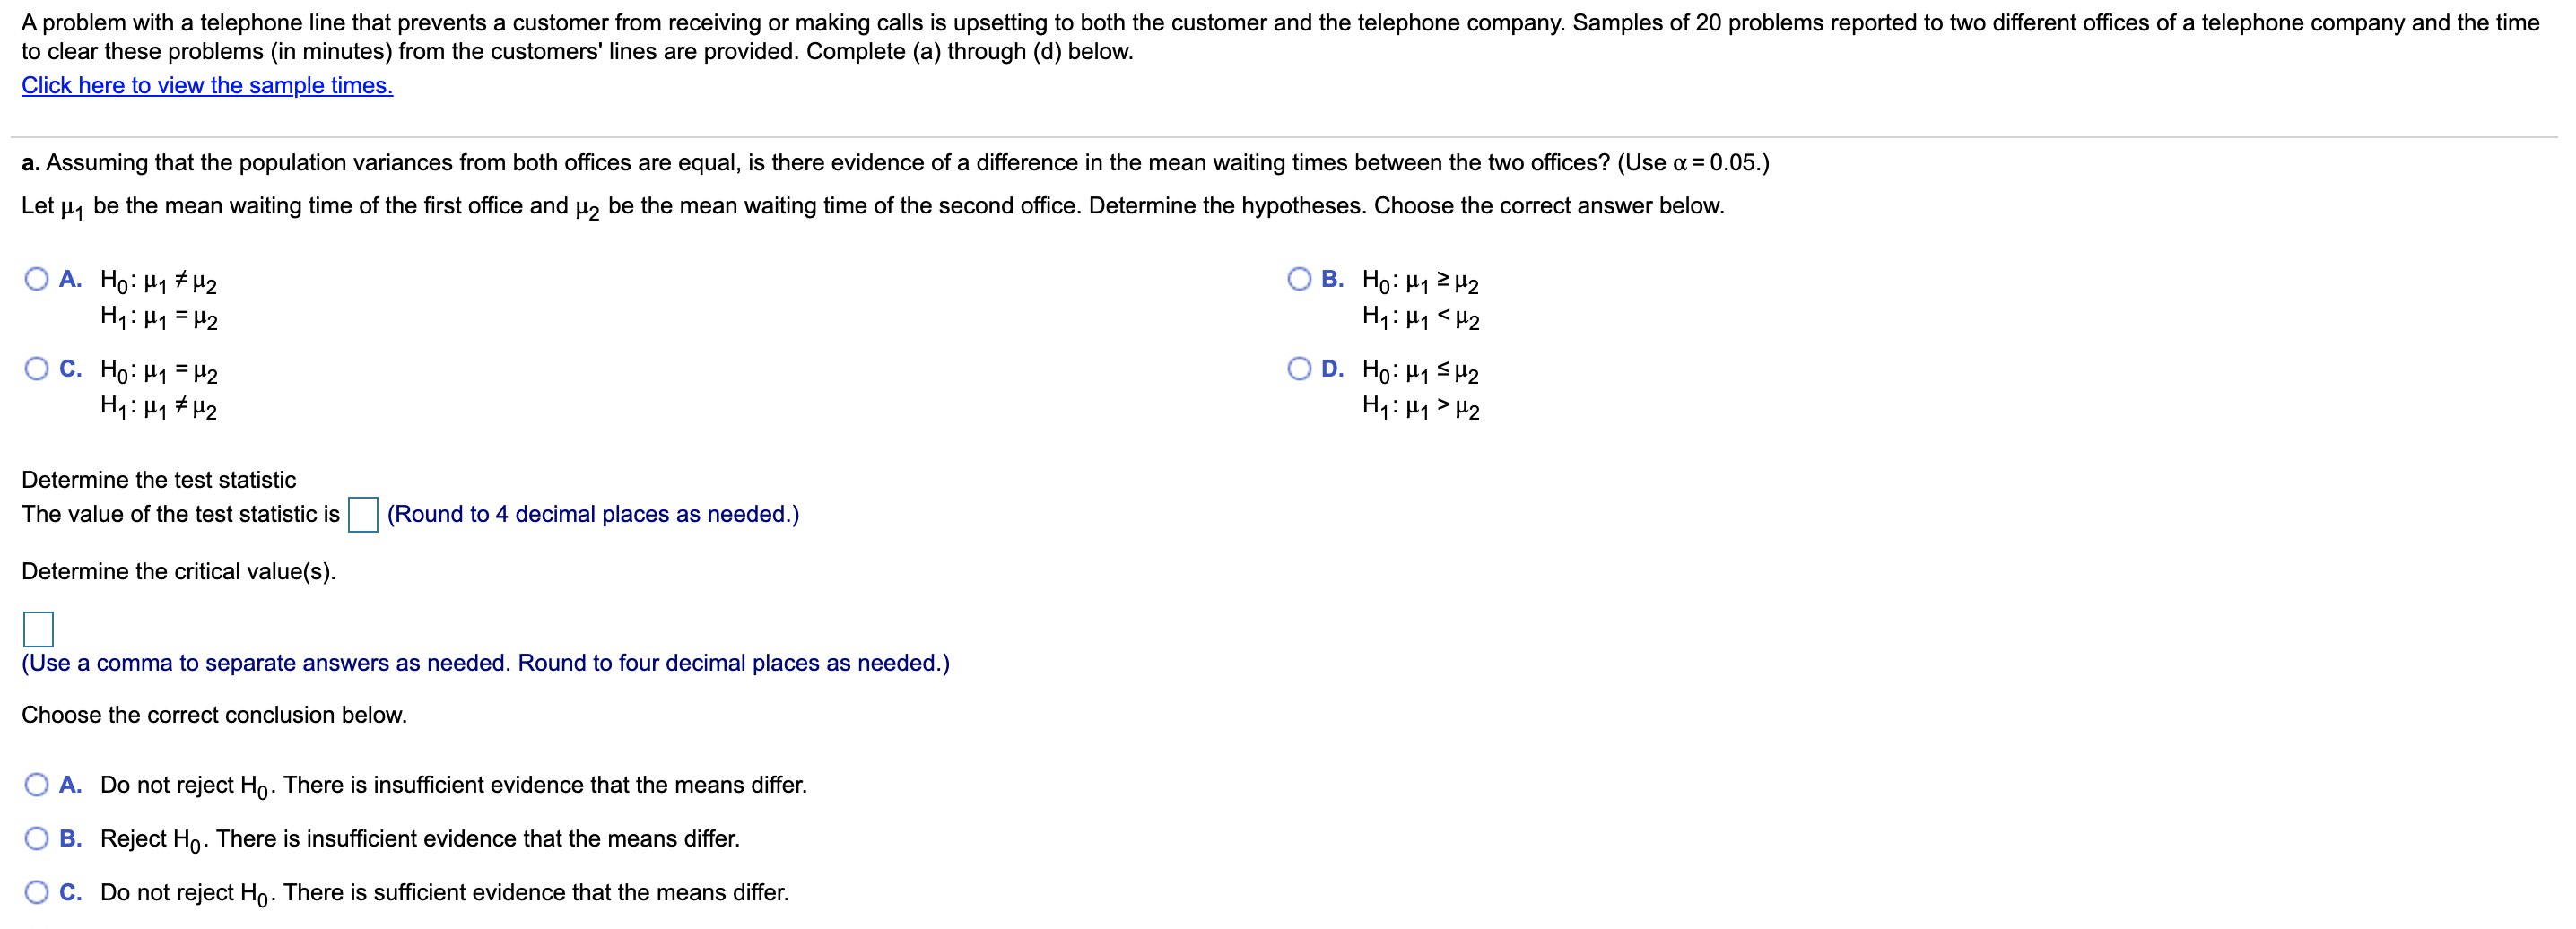
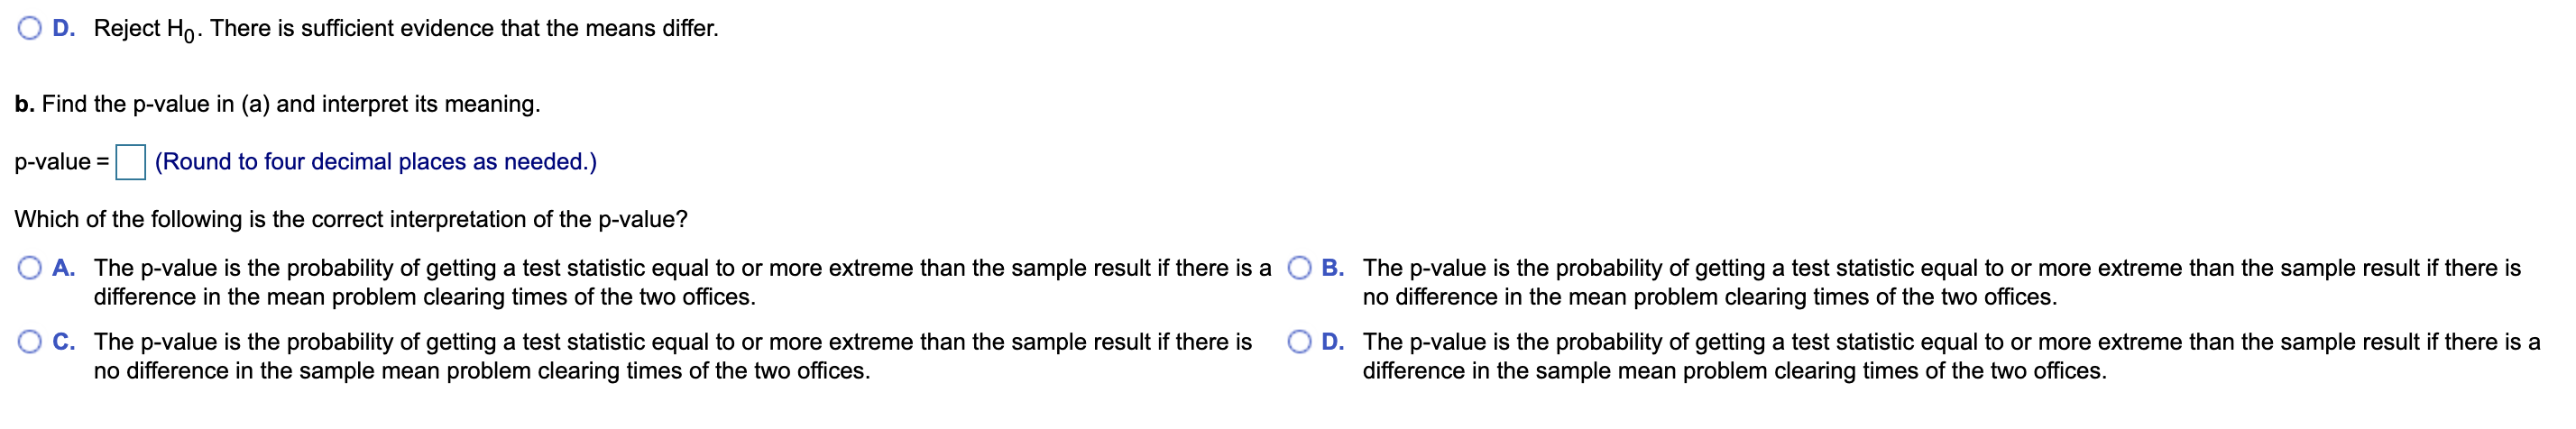
Assume that you have a sample of n, = 4, with the sample mean X, = 50, and a sample standard deviation of S, = 5, and you have an independent sample of n2 = 7 from another population with a sample mean of X2 = 35 and the sample standard deviation S2 =6. Assuming the population variances are equal, at the 0.01 level of significance, is there evidence that 1 > H2? Determine the hypotheses. Choose the correct answer below. OA. HO: M1 SH2 OB. HO: H1 = H2 H1: M1 > H2 H1: My # H2 O C. Ho: H1 > H2 OD. HO: M1 # H2 H1: M1 S H2 H1: 1 1 = H2 Find the test statistic. The value of the test statistic = (Round to 4 decimal places as needed.) Find the p-value. p-value = (Round to four decimal places as needed.) Choose the correct conclusion below. O A. Do not reject Ho. There is insufficient evidence that M1 > H2. O B. Reject Ho. There is insufficient evidence that 1 > M2. O C. Reject Ho. There is sufficient evidence that M1 > H2. O D. Do not reject Ho. There is sufficient evidence that My > H2.For each of the cases that follow, identify the rejection region that should be used to test Ho: 0'? s 6% against Ha: a? > a; . Assume that d.f..I = 8, d.f.2 = 30. a. or=0.10 b. a = 0.05 c. a=0.025 d. a = 0.01 a. The rejection region is F > (Round to the nearest hundredth as needed.) b. The rejection region is F > . (Round to the nearest hundredth as needed.) c. The rejection region is F > (Round to the nearest hundredth as needed.) d. The rejection region is F > (Round to the nearest hundredth as needed.) The following information is available for two samples drawn from independent normally distributed populations. Population A: n = 16 $2 = 153.2 Population B: n = 16 S' = 122.9 What is the value of FSTAT if you are testing the null hypothesis Ho: 01 =02? IMPORTANT NOTE: In all of these questions, there are 2 possible ratios A/B and B/A! Our convention is to always assume that the larger variance is in the numerator (i.e., on top). The correct answer will always be found in this fashion. Similarly, in questions about a critical value, we shall consider the right (upper) tail. The value of FSTAT is. (Round to two decimal places as needed.)A particular magazine identified the top accounting firms in 12 geographic regions across a certain country. Even though all 12 regions reported growth in the past year, region A and region B reported the highest combined growths, with 25% and 20%, respectively. A characteristic description of the accounting firms in these regions included the number of partners in the firm. The accompanying table contains data on the number of partners. Complete parts (a) through (d) below. Click on the icon to view the data table. IMPORTANT NOTE: In all of these questions, there are 2 possible ratios A/B and B/A! Our convention is to always assume that the larger variance is in the numerator (i.e., on top). The correct answer will always be found in this fashion. Similarly, in questions about a critical value, we shall consider the right (upper) tail. a. At the 0.01 level of significance, is there evidence of a difference in the variability in numbers of partners for region A accounting firms and region B accounting firms? Determine the hypotheses, where of is the population variance of the numbers of partners for region A accounting firms and o? is the population variance of the numbers of partners for region B accounting firms. Choose the correct answer below. OA. Ho: 07 202 OB. Ho: 07 502 H1: 09 H 1 : 07 20 7 OC. Ho: 2 # 07 02 = 03 OD. HO: 01 H1: 07 = 03 027 02 Compute the FSTAT test statistic. FSTAT = (Round to three decimal places as needed.) Determine the critical value. The critical value is. (Round to three decimal places as needed.)State the conclusion. V Ho. There is E evidence to support the claim that the variability of the numbers of partners for the two regions' accounting rms are different. b. Find the p-value. The pvalue is . (Round to three decimal places as needed.) What does the p-value mean? The probability of obtaining samples that give rise to a test statistic E the 7 , found previously, is equal to the p-value if the population variances of the number of partners for both regions are the same. c. What assumption has to be made about the two populations in order to justify the use of the F test? 0 A. The samples are taken from populations that have the same mean. 0 B. The samples are taken from populations that are independent and identically distributed. 0 C. The samples are taken from populations that have the same variance. 0 D. The populations do not contain any outliers. O E. Each of the two populations is normallv distributed. d. Based on (a) and (b), which t test should be used to test whether there is a significant difference in the mean number of partners for region A accounting firms and region B accounting firms? O A. A separate-variance t test should be used because the test of hypothesis indicated that the population variances of the number of partners for the regions are equal. O B. A pooled-variance t test should be used because the test of hypothesis indicated that the population variances of the number of partners for the regions are not equal. O C. A separate-variance t test should be used because the test of hypothesis indicated that the population variances of the number of partners for the regions are not equal. O D. A pooled-variance t test should be used because the test of hypothesis indicated that the population variances of the number of partners for the regions are equal.A random sample of 15 customers in two different banks were selected and their wait times (in minutes) are given below. Use this data to complete parts (a) through (d). IMPORTANT NOTE: In all of these questions, there are 2 possible ratios A/B and B/A! Our convention is to always assume that the larger variance is in the numerator (i.e., on top). The correct answer will always be found in this fashion. Similarly, in questions about a critical value, we shall consider the right (upper) tail. Bank A 3.47 3.16 4.39 6.06 0.43 5.12 6.54 6.09 3.86 4.12 5.61 3.06 5.13 4.76 2.25 Bank B 9.67 5.83 8.19 5.76 8.81 3.84 8.07 8.33 10.52 6.65 5.68 4.03 6.26 9.88 5.37 a. Is there evidence of a difference in the variability of the waiting time between the two banks? (Use a = 0.05.) Determine the hypotheses. Choose the correct answer below. O A. Ho: 02 so? OB. Ho: 2 707 H 1 : 07 > 07 H1 : 09 = 02 OC. Ho: 2 =0? OD. Ho: 07 202 H1:09707 H: 0967 . Use a= 0.10. Determine the test statistic. F = (Round to two decimal places as needed.) Find the p-value. p= (Round to three decimal places as needed.) Determine a conclusion. Choose the correct answer below. O A. Reject Ho. There is insufficient evidence to conclude that the variance of sample 1 is greater than the variance of sample 2. O B. Reject Ho. There is sufficient evidence to conclude that the variance of sample 1 is greater than the variance of sample 2. O C. Do not reject Ho. There is insufficient evidence to conclude that the variance of sample 1 is greater than the variance of sample 2. O D. Do not reject Ho. There is sufficient evidence to conclude that the variance of sample 1 is greater than the variance of sample 2.A problem with a telephone line that prevents a customer from receiving or making calls is upsetting to both the customer and the telephone company. Samples of 20 problems reported to two different offices of a telephone company and the time to clear these problems (in minutes) from the customers' lines are provided. Complete (a) through (d) below. Click here to view the sample times. a. Assuming that the population variances from both offices are equal, is there evidence of a difference in the mean waiting times between the two offices? (Use a = 0.05.) Let My be the mean waiting time of the first office and 2 be the mean waiting time of the second office. Determine the hypotheses. Choose the correct answer below. OA. HO: H1 # H2 OB. HO: H1 2 H2 H1: 1 1 = H2 H1: My H 2 Determine the test statistic The value of the test statistic is (Round to 4 decimal places as needed.) Determine the critical value(s). Use a comma to separate answers as needed. Round to four decimal places as needed.) Choose the correct conclusion below. O A. Do not reject Ho. There is insufficient evidence that the means differ. O B. Reject Ho. There is insufficient evidence that the means differ. O C. Do not reject Ho. There is sufficient evidence that the means differ.O D. Reject H0. There is sufcient evidence that the means differ. b. Find the p-value in (a) and interpret its meaning. pvalue = (Round to four decimal places as needed.) Which of the following is the correct interprehticn of the p-value? O A. The p-value is the probability of getting a test statistic equal to or more extreme than the sample result if there is a O B. The p-value is the probability of getting a test statistic equal to or more extreme than the sample result if there is ditferenoe in the mean problem clearing times of the two ofces. no difference in the mean problem clearing times of the two oices, O C. The pvalue is the probability of getting a test statistic equal to or more extreme than the sample result if there is O D. The p-value is the probability of getting a test statistic equal to or more extreme than the sample result if there is a no difference in the sample mean problem clearing times of the two ofces. difference in the sample mean problem clearing times of the two ofces
Step by Step Solution
There are 3 Steps involved in it

Get step-by-step solutions from verified subject matter experts