

Answered step by step
Verified Expert Solution
Question
1 Approved Answer
please answer the yellow section (i.e. common size income statement and balance sheet) thank you Financial statements 2018 2019 2020 2021 2022E Balance Sheet At
please answer the yellow section (i.e. common size income statement and balance sheet) thank you 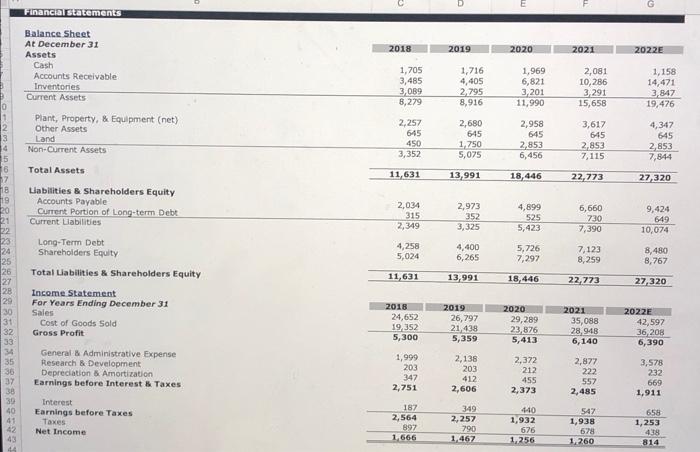
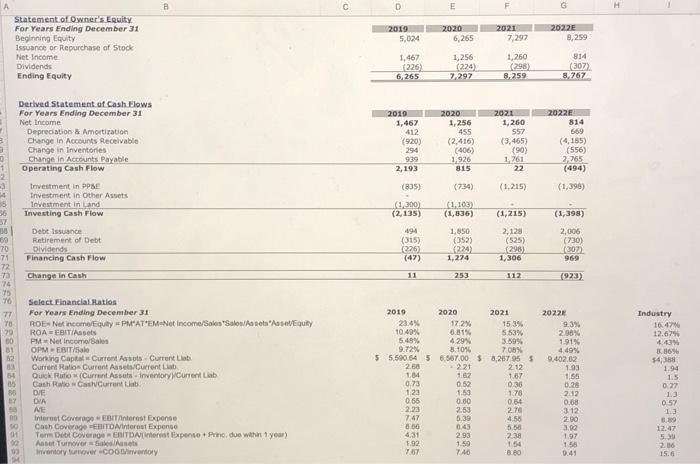
Financial statements 2018 2019 2020 2021 2022E Balance Sheet At December 31 Assets Cash Accounts Receivable Inventories Current Assets 1,705 3,485 3,089 8,279 1,716 4,405 2,795 8,916 1,969 6,821 3,201 11,990 2,081 10,286 3,291 15,658 1,158 14,471 3,847 19,476 Plant, Property, & Equipment (net) Other Assets Land Non-Current Assets 2,257 645 450 3,352 2,680 645 1,750 5,075 2,958 645 2,853 6,456 3,617 645 2,853 7,115 4,347 645 2,853 7,844 Total Assets 11,631 13,991 18,446 22,773 27,320 18 20 Liabilities & Shareholders Equity Accounts Payable Current Portion of Long-term Debt Current Liabilities 2,034 315 2,349 2,973 352 3,325 4,899 525 5,423 6,660 730 7,390 9,424 649 10,074 22 4,258 5,024 4,400 6,265 5,726 7,297 7,123 8,259 8,480 8,767 26 11,631 13,991 18,446 22, 773 27,320 28 29 30 Long-Term Debt Shareholders Equity Total Liabilities & Shareholders Equity Income Statement For Years Ending December 31 Sales Cost of Goods Sold Gross Profit 2018 24,652 19 352 5,300 2019 26,797 21438 5,359 2020 29,289 23,876 5,413 2021 35,088 28.948 6,140 32 33 2022E 42,597 36 208 6,390 General & Administrative Expense Research & Development Depreciation & Amortization Earnings before Interest & Taxes 1,999 203 347 2,751 2,138 203 412 2,606 2,372 212 455 2,373 2,877 222 557 2,485 3,578 232 669 1,911 36 37 38 30 40 41 42 43 Interest Earnings before Taxes Taxes Net Income 187 2,564 897 1,666 349 2,257 790 1,467 440 1,932 626 1,256 547 1,938 678 1,260 658 1,253 4.38 814 c D E G 2020 2019 5,024 2021 7,297 2022E 8,259 6,265 Statement of Owner's Equity For Years Ending December 31 Beginning Equity Issuance or Repurchase of Stock Net Income Dividends Ending Equity 1,467 226) 6,265 1,256 (224) 7.297 1,260 (298) 8.259 814 (307) 3,767 Derived Statement of Cash Flows For Years Ending December 31 Net Income Depreciation Amortization Change in Accounts Receivable Change in Inventories Change in Accounts Payable Operating Cash Flow 2019 1,467 412 (920) 294 939 2,193 2020 1,256 455 (2,416) (406) 1.926 815 2021 1,260 557 (3,465) (90) 1261 22 2022 814 569 (4185) (556) 2,265 (494) 3 0 1 (835) (734) (1.215) (1,396) Investment in PPSE Investment in Other Assets Investment in Land Investing Cash Flow (1.300) (2,135) (1.103) (1,836) (1,215) (1,398) 494 (315) 226) Debt Issuance Retirement of Debt Dividends Financing Cash Flow Change in Cash 69 70 71 72 73 74 350 (352) 224 1,274 2,12 (525) 298) 1,306 2,000 (730) (307 969 (47) 11 253 112 (923) 70 77 78 179 00 31 - 221 Select Financial Ratios For Years Ending December 31 ROE Net income Equity PM'ATEM-Net Income/Sales Salonasesse Equity ROA EBITA PM Net Income OPM EBIT/50 Working Capital Current Assets Current Liabi Current Ratio Current Assets Current Lab Quick Ratio (Current Assets inventory Current Lab Cash Ratio CashCurrent in DE DIA NE Interest Coverage interest Expense Cooh Coverage FEMTONinterest Expense Term Debt Coverage ENITDinterest Expense. Prino due within 1 yow) Aanar Tumorer-net Inventory umover.Conventory 54 2019 2020 2021 23.4% 17.2% 15.3% 10.49% 6.81% 5.53% 6.49% 4.29% 389% 9.72% 3.10% 700 55.500.54 56.567.00 $8,267 955 2.50 2.12 1,04 1.62 1.67 0.73 0.52 0.36 123 1.53 170 0.55 0.00 0.64 2.23 2.53 2.70 747 6.30 4.56 8.65 0.43 5.50 4.31 2.93 238 1.92 1.50 154 746 8180 2022 9.3% 2.96% 191% 4.49% 9.402.02 1.93 1,56 0.28 2012 0.68 3.12 2.00 3.92 1.97 156 0.41 Industry 16:47 12.679 4. 3.86% 54,38 1.94 1.5 0.27 13 0.52 10 30 BY 91 90 12:47 5. 2.16 15.6 767 Common-Size Balance Sheet 2018 2019 2020 2021 2022E Common-Size Income Statement 2018 2019 2020 2021 2022E Step by Step Solution
There are 3 Steps involved in it
Step: 1

Get Instant Access to Expert-Tailored Solutions
See step-by-step solutions with expert insights and AI powered tools for academic success
Step: 2

Step: 3
Ace Your Homework with AI
Get the answers you need in no time with our AI-driven, step-by-step assistance
Get Started
The Business Of Personal Finance
Authors: Joseph Calandro Jr, John Hoffmire
1st Edition
1032104562, 978-1032104560