

Question: Please answer these questions and put them in a readable format (ex. 1a, 1b, 2a, 2b, etc...). No explanation needed. Only fix the incorrect answer.
Please answer these questions and put them in a readable format (ex. 1a, 1b, 2a, 2b, etc...). No explanation needed. Only fix the incorrect answer.
4.
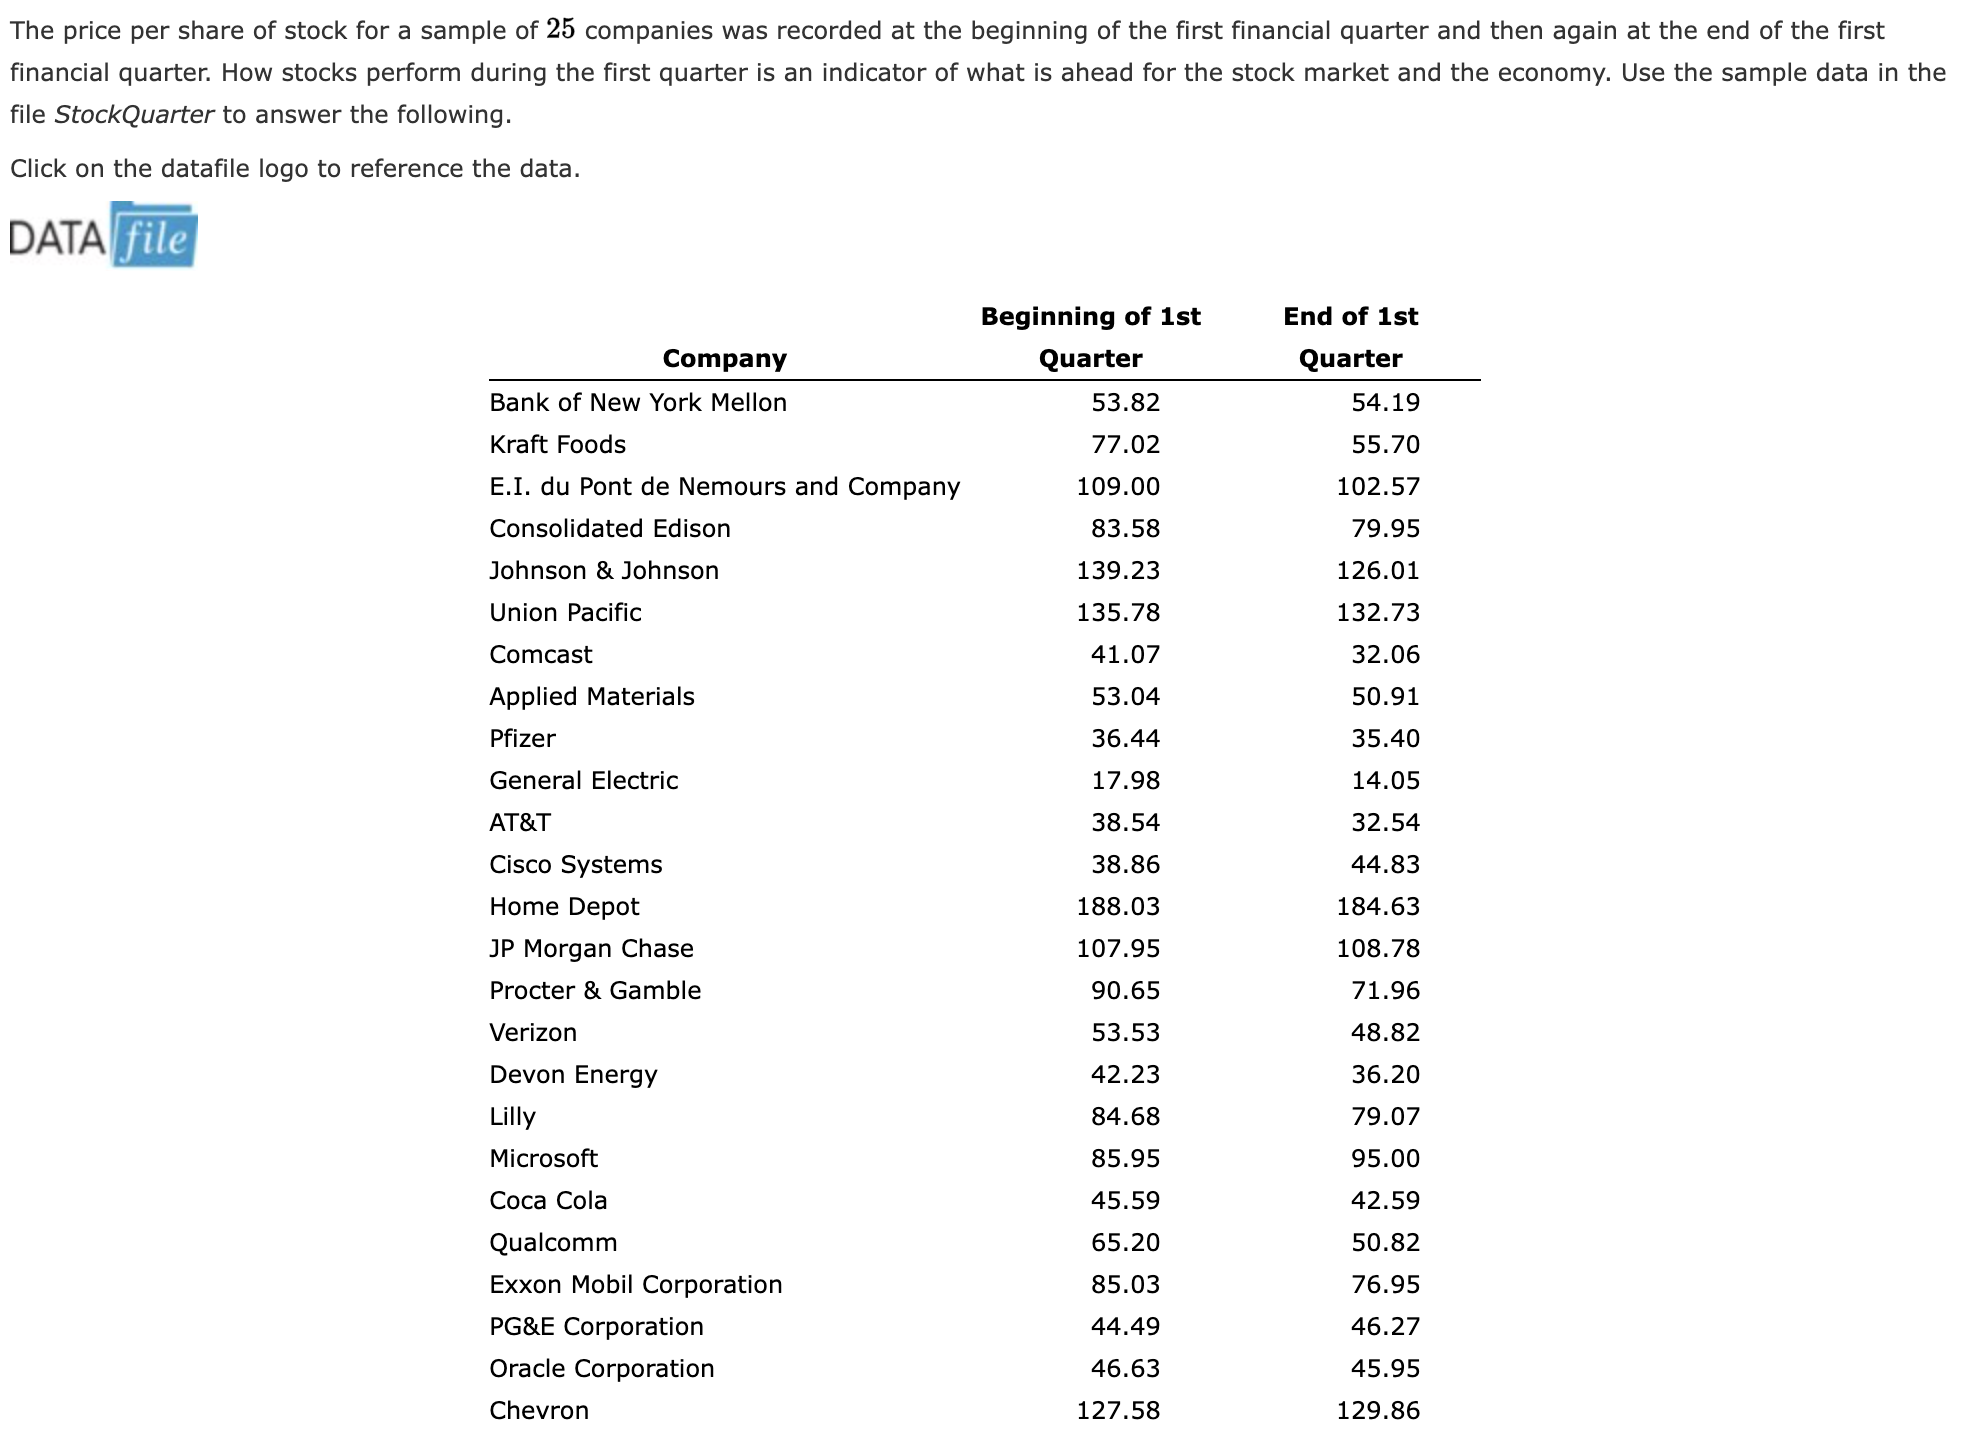
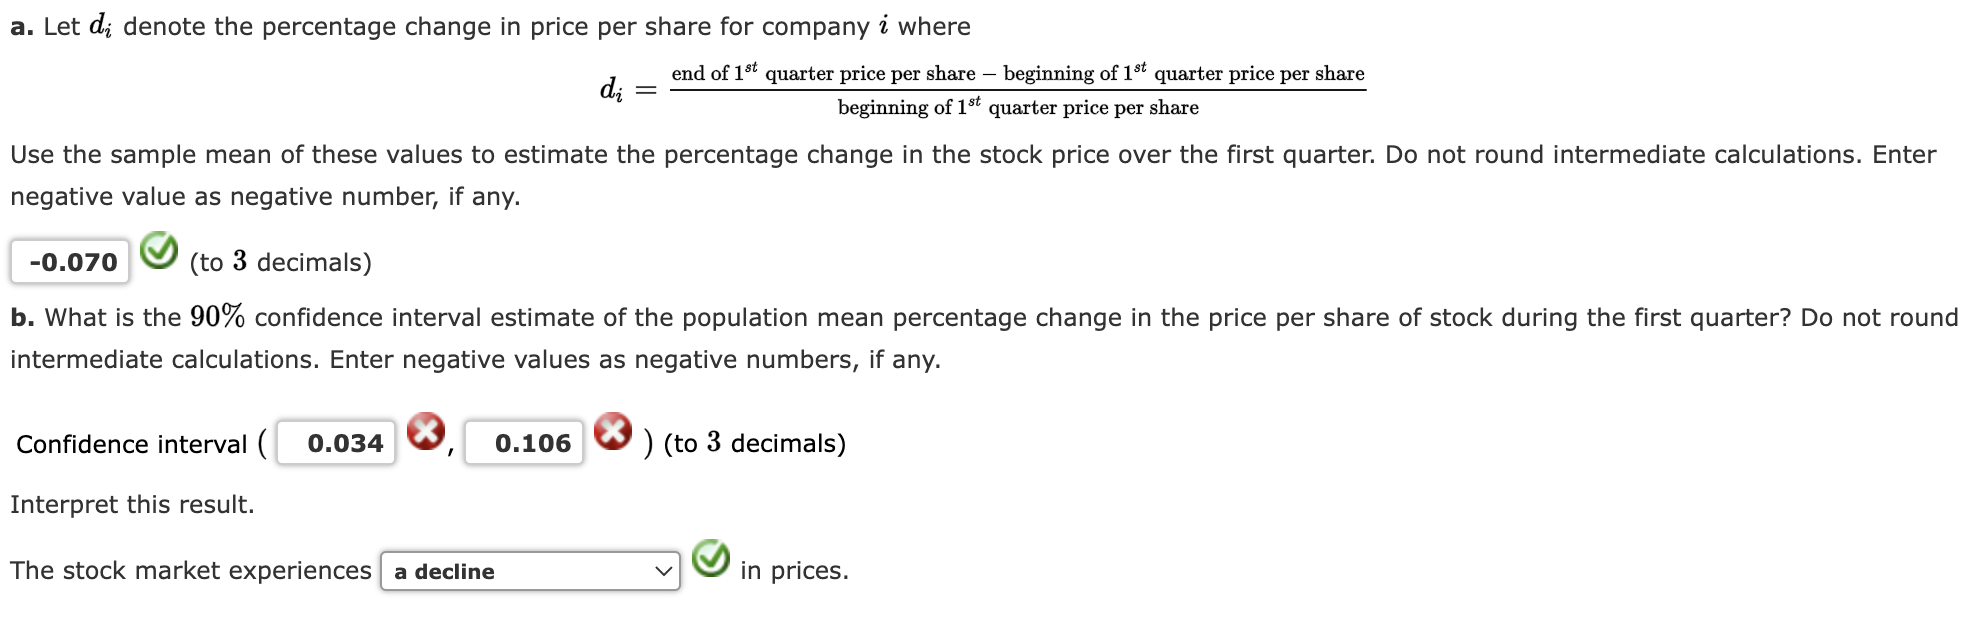
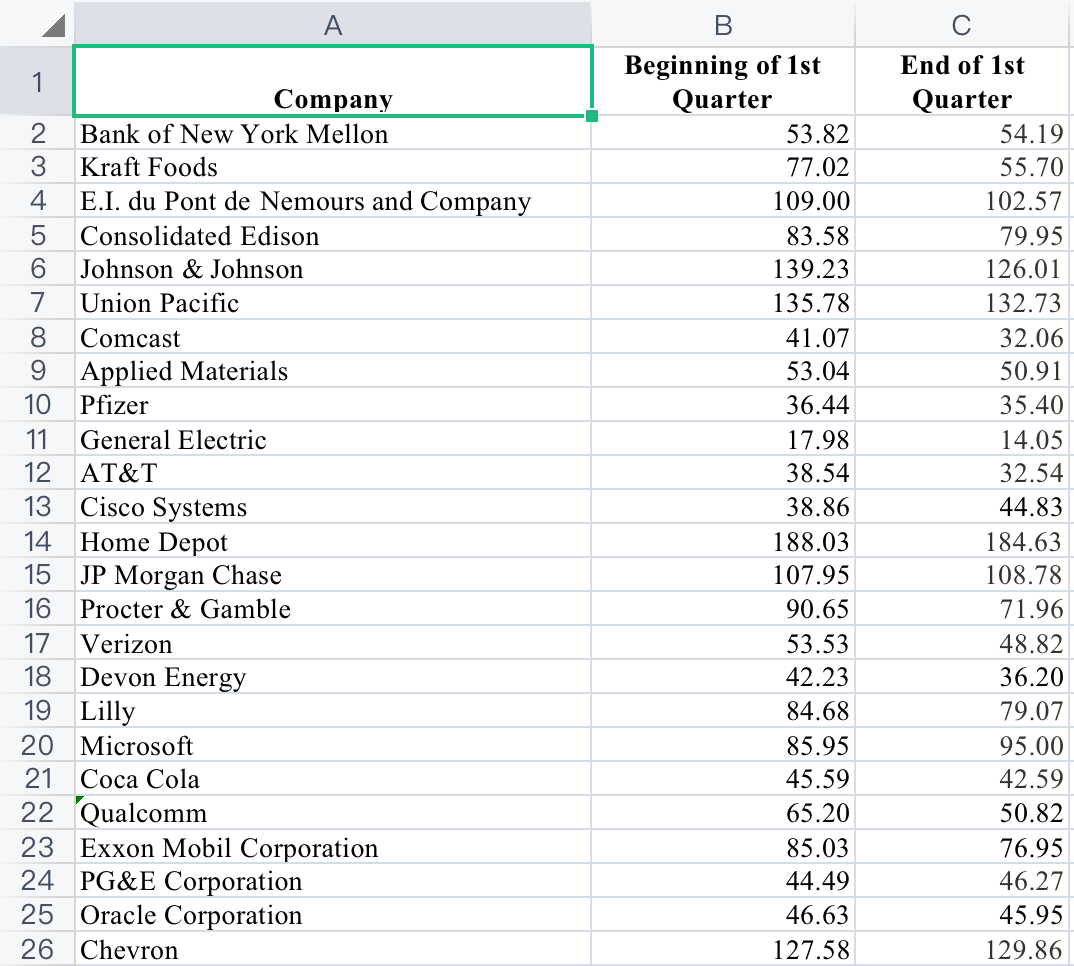
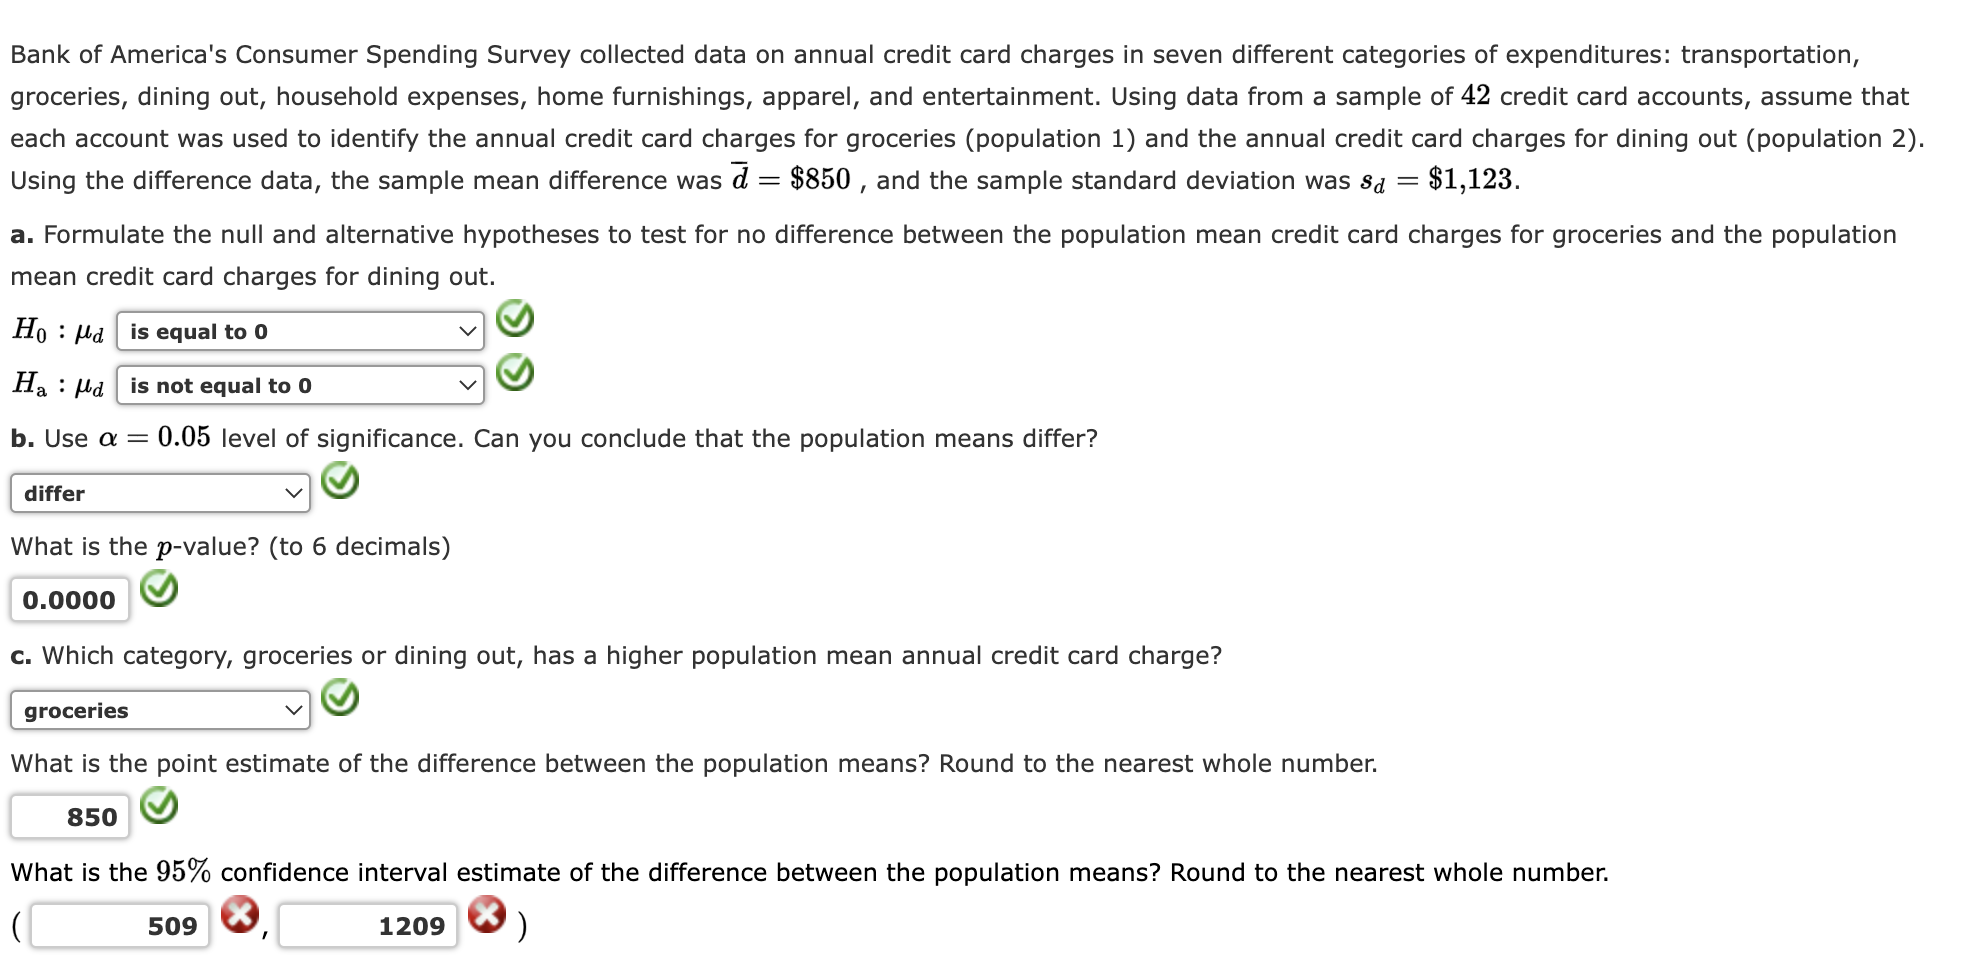
The price per share of stock for a sample of 25 companies was recorded at the beginning of the first financial quarter and then again at the end of the first financial quarter. How stocks perform during the first quarter is an indicator of what is ahead for the stock market and the economy. Use the sample data in the file StockQuarter to answer the following. Click on the datafile logo to reference the data. DATA file Beginning of 1st End of 1st Company Quarter Quarter Bank of New York Mellon 53.82 54.19 Kraft Foods 77.02 55.70 E.I. du Pont de Nemours and Company 109.00 102.57 Consolidated Edison 83.58 79.95 Johnson & Johnson 139.23 126.01 Union Pacific 135.78 132.73 Comcast 41.07 32.06 Applied Materials 53.04 50.91 Pfizer 36.44 35.40 General Electric 17.98 14.05 AT&T 38.54 32.54 Cisco Systems 38.86 44.83 Home Depot 188.03 184.63 JP Morgan Chase 107.95 108.78 Procter & Gamble 90.65 71.96 Verizon 53.53 48.82 Devon Energy 42.23 36.20 Lilly 84.68 79.07 Microsoft 85.95 95.00 Coca Cola 45.59 42.59 Qualcomm 65.20 50.82 Exxon Mobil Corporation 85.03 76.95 PG&E Corporation 44.49 46.27 Oracle Corporation 46.63 45.95 Chevron 127.58 129.86a. Let di denote the percentage change in price per share for company'i where d end of 1\" qumter price per share 7 beginning of 1"t quintet price per share 1. beginning of 1'6 quarter price per Share Use the sample mean of these values to estimate the percentage change in the stock price over the first quarter. Do not round intermediate calculations. Enter negative value as negative number, if any. -0.070 Q0 (to 3 decimals) b. What is the 90% confidence interval estimate of the population mean percentage change in the price per share of stock during the first quarter? Do not round intermediate calculations. Enter negative values as negative numbers, if any. Confidence interval ( 0.034 0, 0.106 0 ) (to 3 decimals) Interpret this result. The stock market experiences \\'9 in prices. A B C Beginning of 1st End of 1st Company Quarter Quarter IN Bank of New York Mellon 53.82 54.19 3 Kraft Foods 77.02 55.70 4 E.I. du Pont de Nemours and Company 109.00 102.57 5 Consolidated Edison 83.58 79.95 6 Johnson & Johnson 139.23 126.01 7 Union Pacific 135.78 132.73 8 Comcast 41.07 32.06 9 Applied Materials 53.04 50.91 10 Pfizer 36.44 35.40 11 General Electric 17.98 14.05 12 AT&T 38.54 32.54 13 Cisco Systems 38.86 44.83 14 Home Depot 188.03 184.63 15 JP Morgan Chase 107.95 108.78 16 Procter & Gamble 90.65 71.96 17 Verizon 53.53 48.82 18 Devon Energy 42.23 36.20 19 Lilly 84.68 79.07 20 Microsoft 85.95 95.00 21 Coca Cola 45.59 42.59 22 Qualcomm 65.20 50.82 23 Exxon Mobil Corporation 85.03 76.95 24 PG&E Corporation 44.49 46.27 25 Oracle Corporation 46.63 45.95 26 Chevron 127.58 129.86Bank of America's Consumer Spending Survey collected data on annual credit card charges in seven different categories of expenditures: transportation, groceries, dining out, household expenses, home furnishings, apparel, and entertainment. Using data from a sample of 42 credit card accounts, assume that each account was used to identify the annual credit card charges for groceries (population 1) and the annual credit card charges for dining out (population 2). Using the difference data, the sample mean difference was 3 = $850 , and the sample standard deviation was 8,1 = $1,123. a. Formulate the null and alternative hypotheses to test for no difference between the population mean credit card charges for groceries and the population mean credit card charges for dining out. Ho = w w H. = m w b. Use a: = 0.05 level of significance. Can you conclude that the population means differ? to What is the pvalue? (to 6 decimals) 0.0000 9 c. Which category, groceries or dining out, has a higher population mean annual credit card charge? 9 roceries V 9 What is the point estimate of the difference between the population means? Round to the nearest whole number. 850 Q0 What is the 95% confidence interval estimate of the difference between the population means? Round to the nearest whole number. ( 509 0,1209 0 )
Step by Step Solution
There are 3 Steps involved in it

Get step-by-step solutions from verified subject matter experts