Question: Please answer these questions excel work is already done. The committee requires a written report with supporting Excelanalyses which should include: Overview of the project
Please answer these questions excel work is already done.
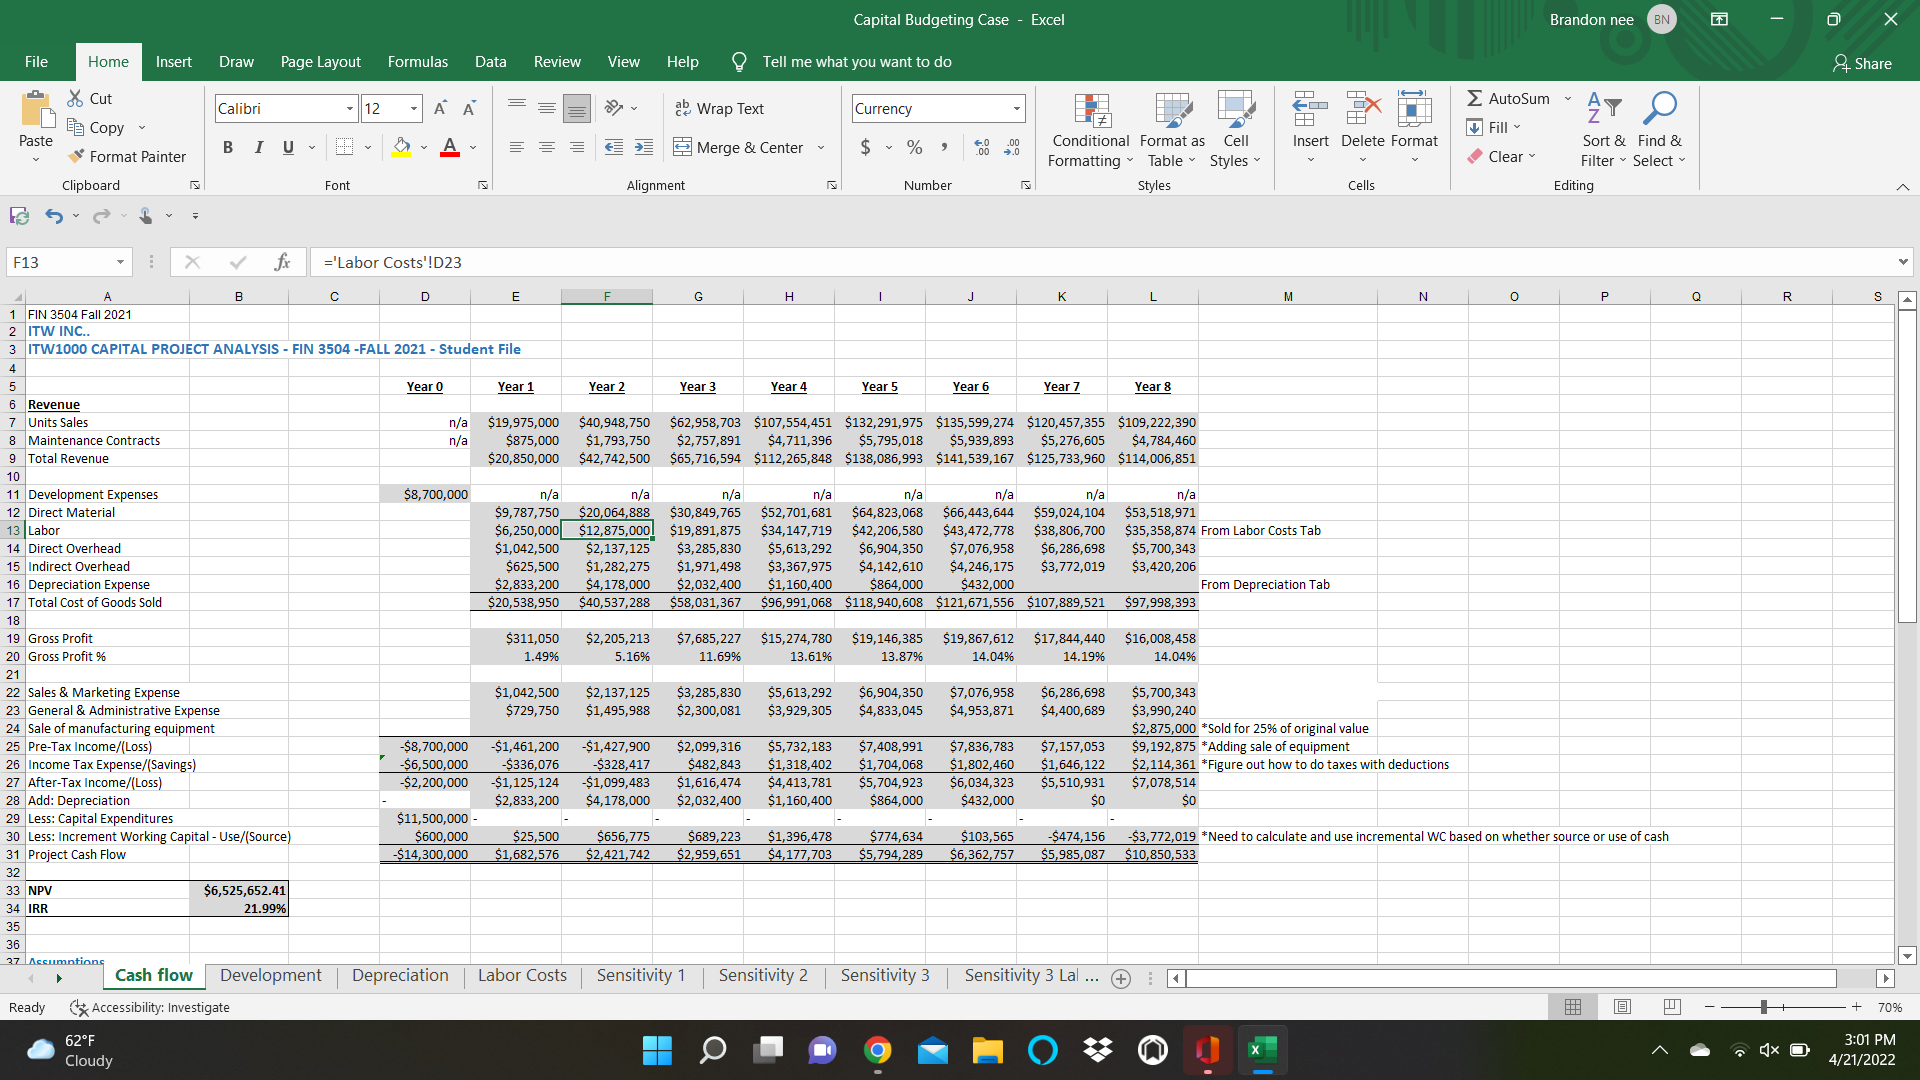
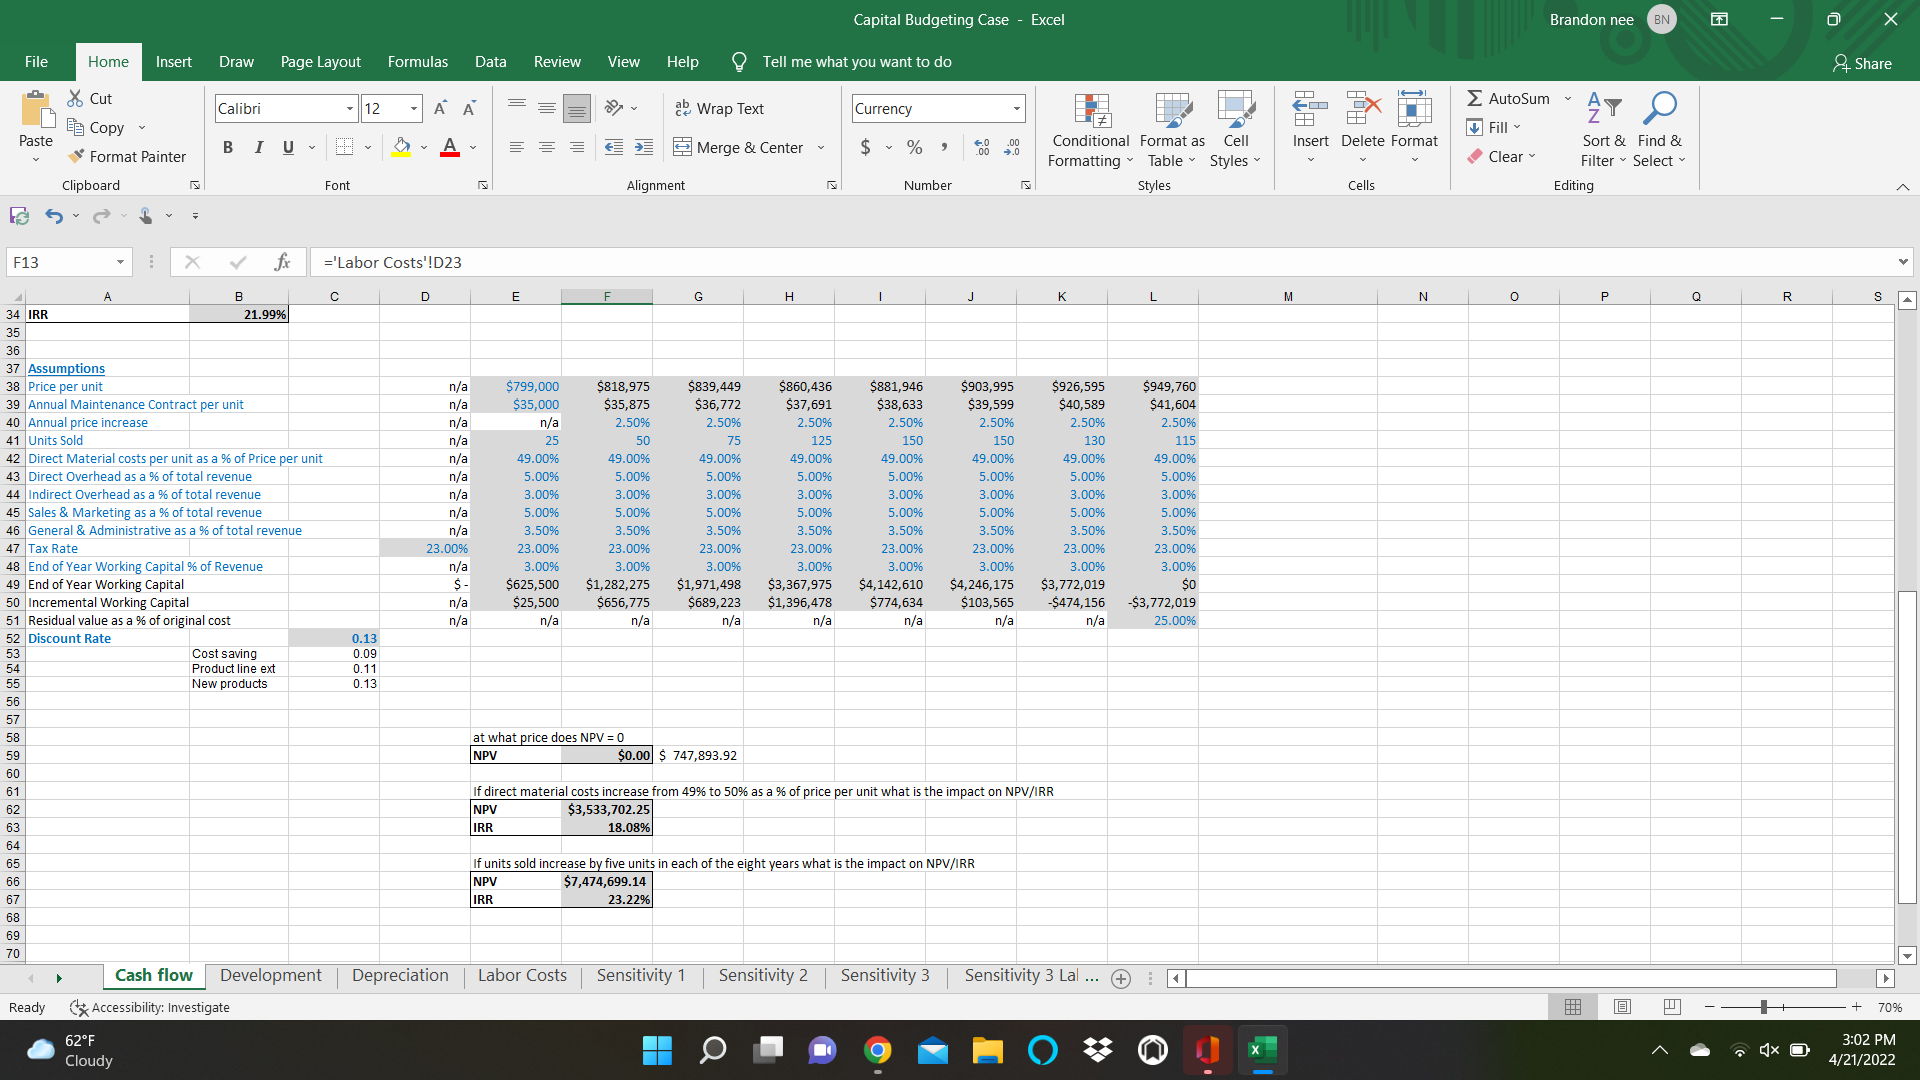
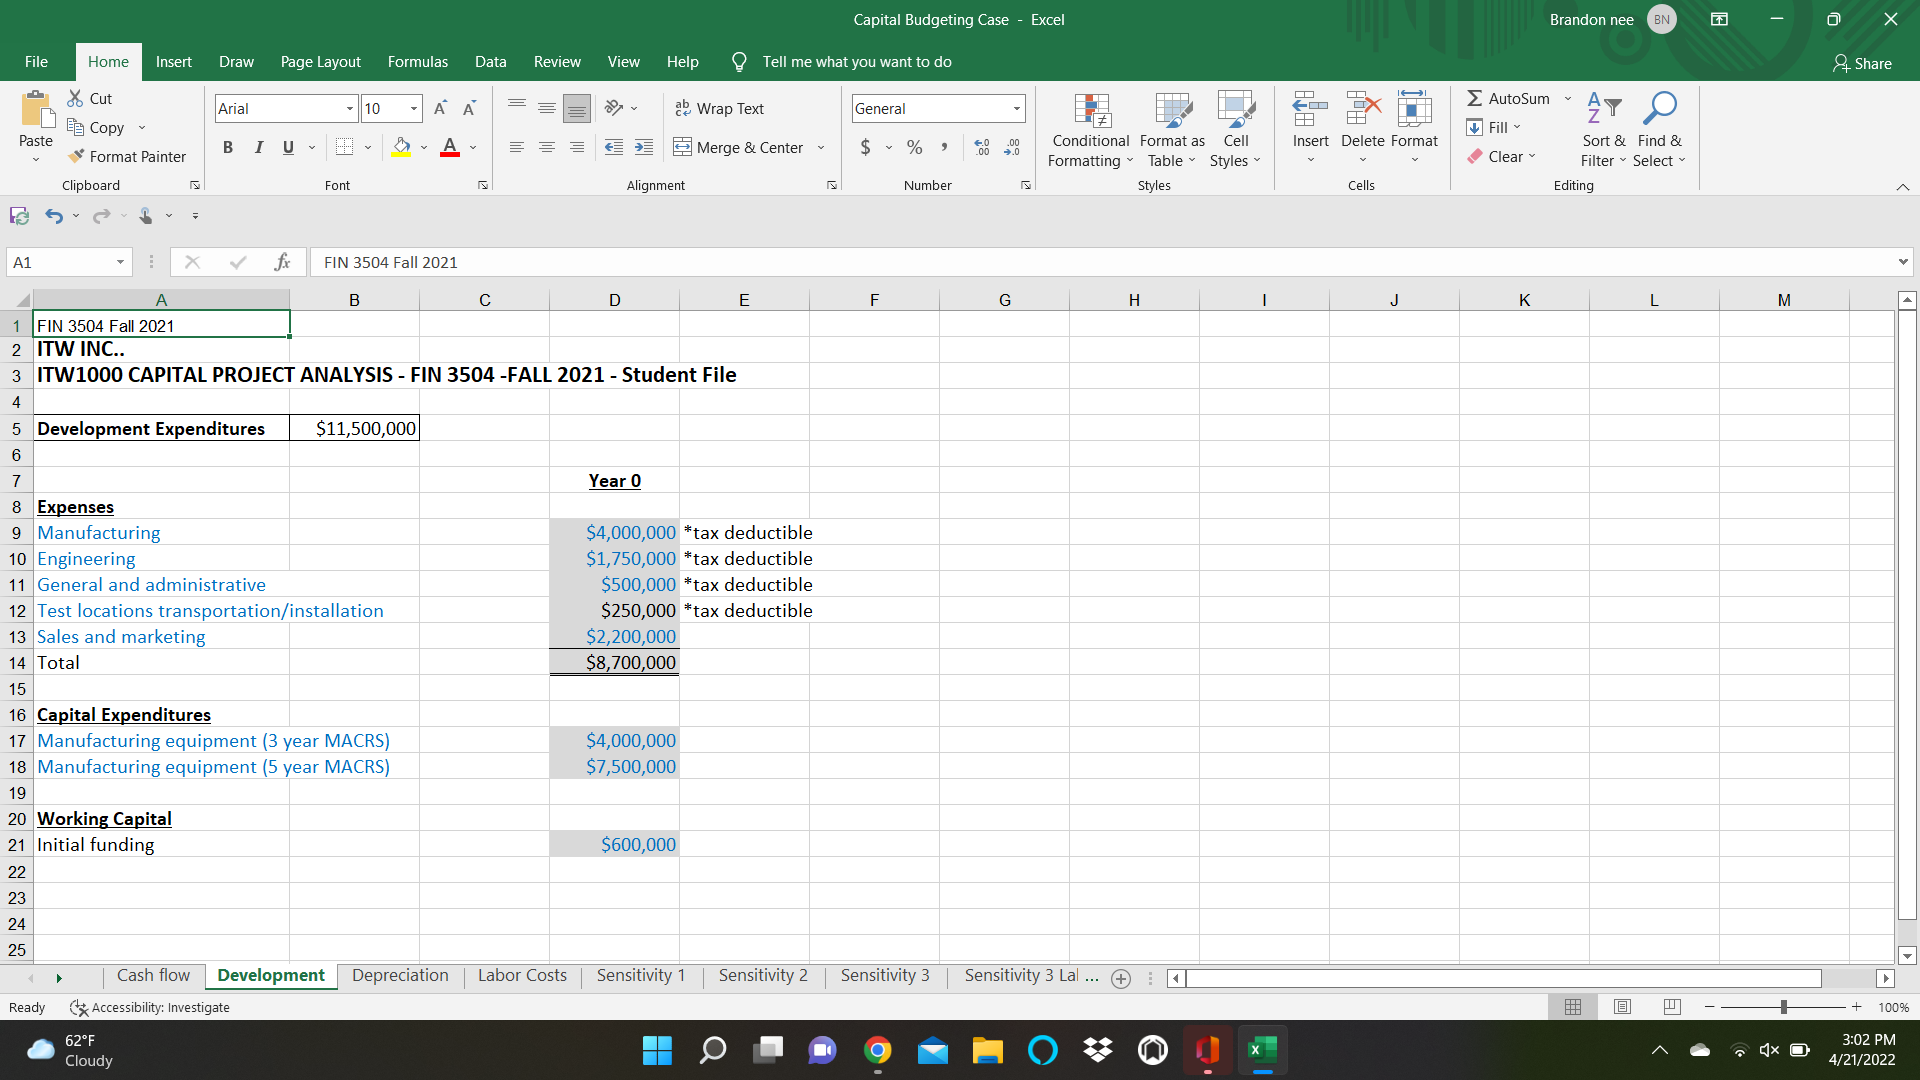
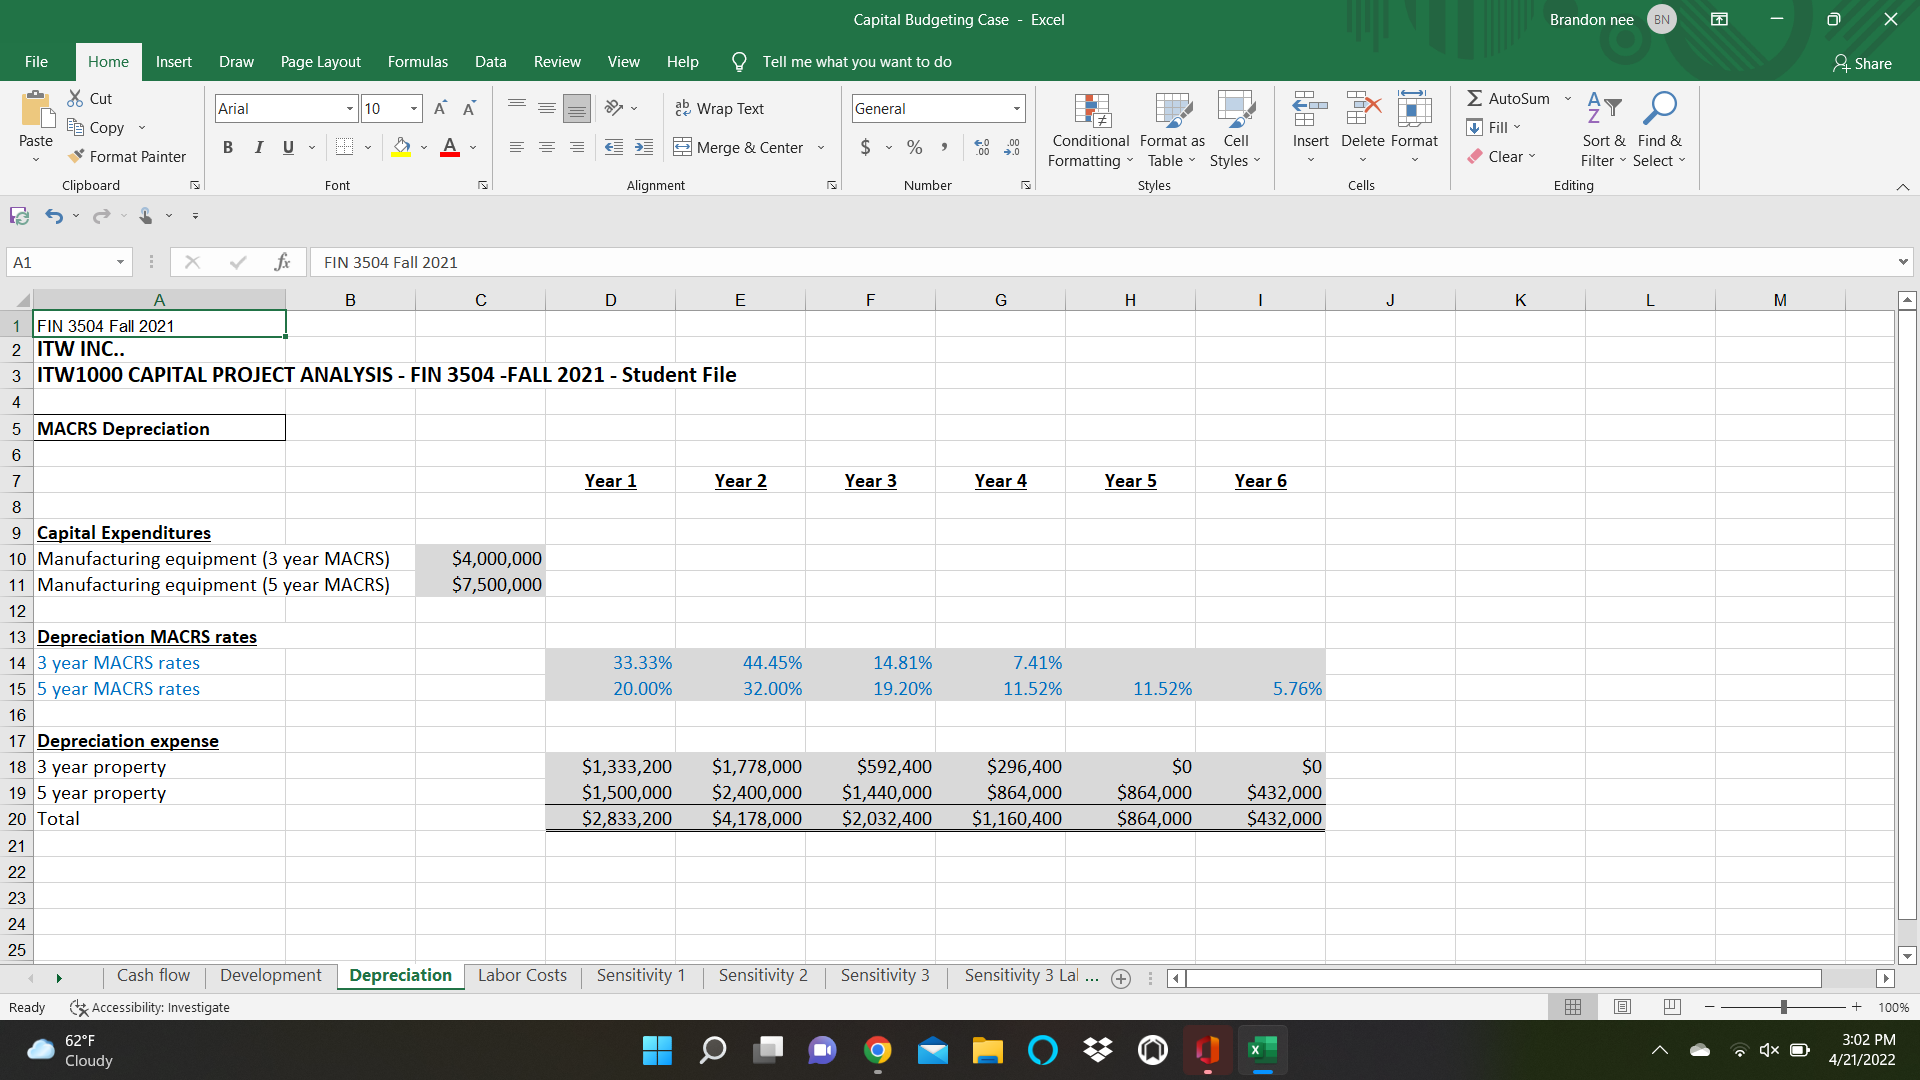
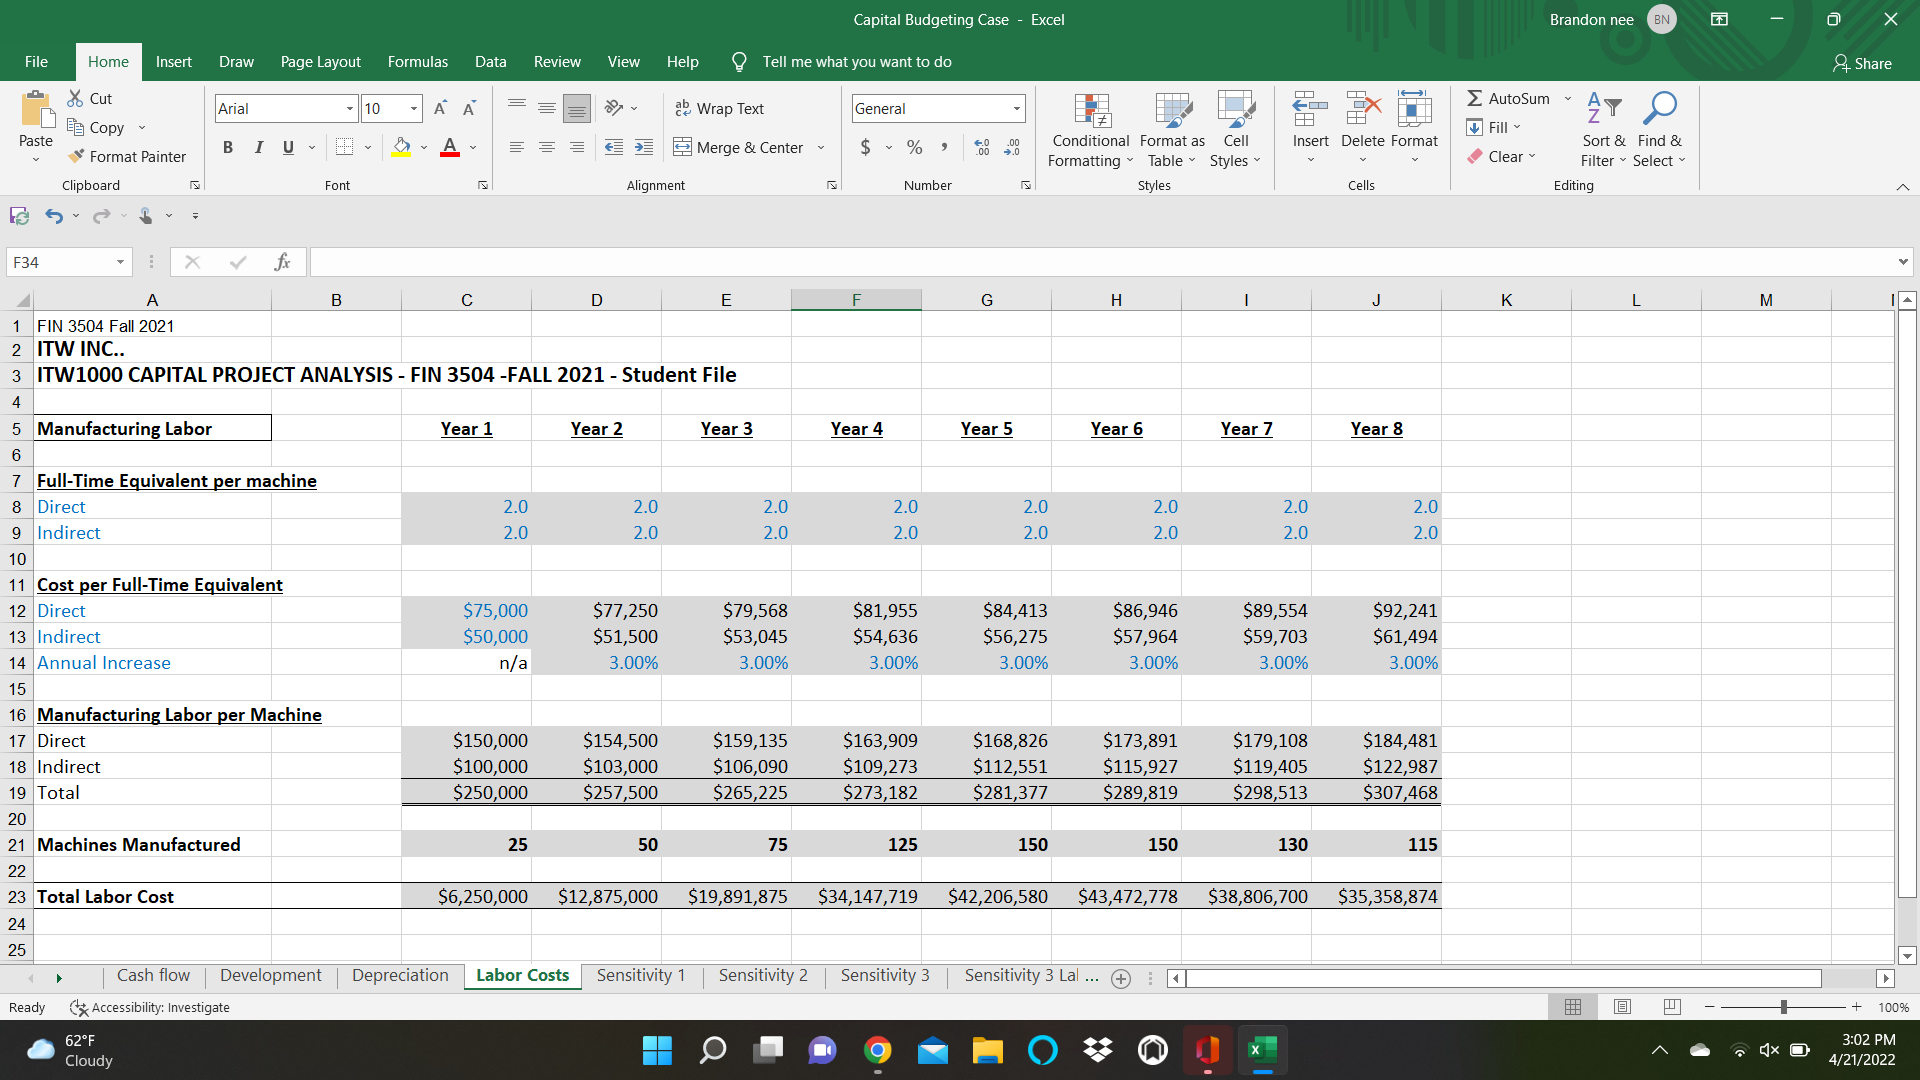
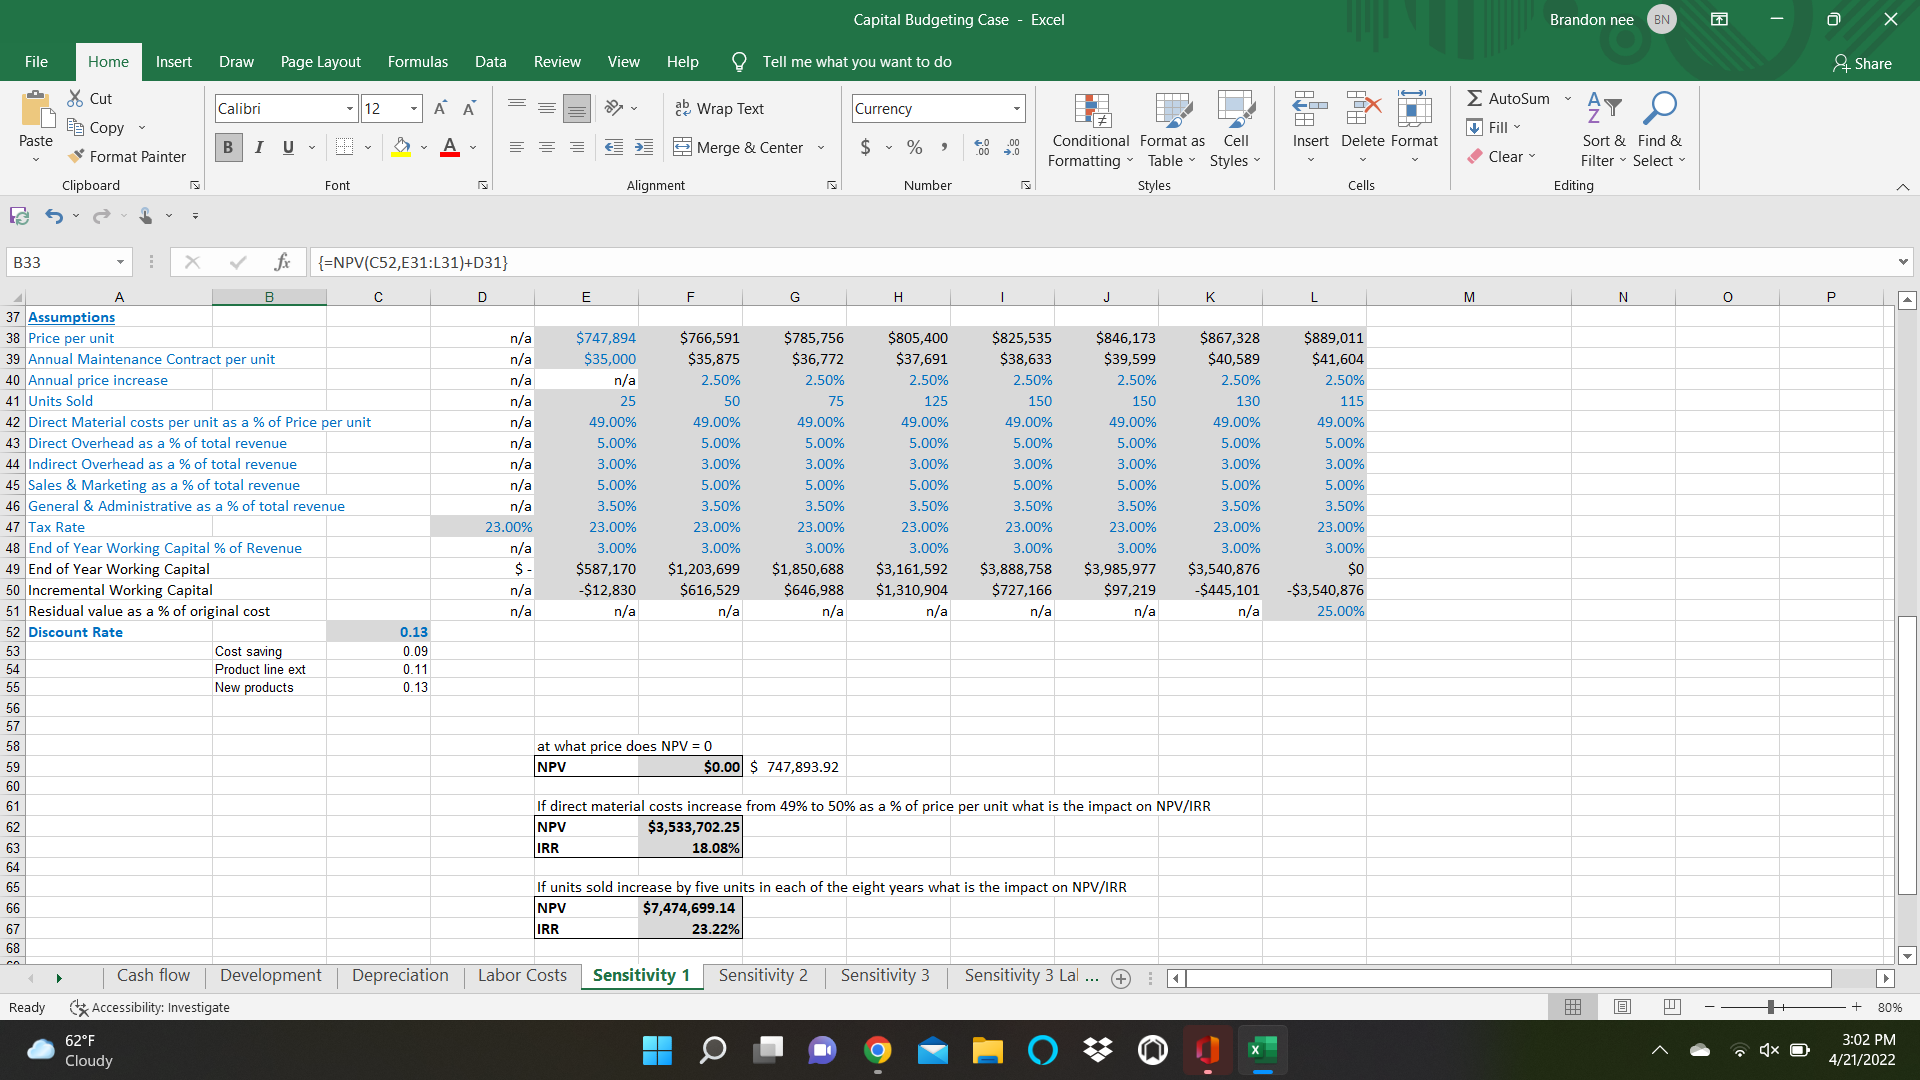
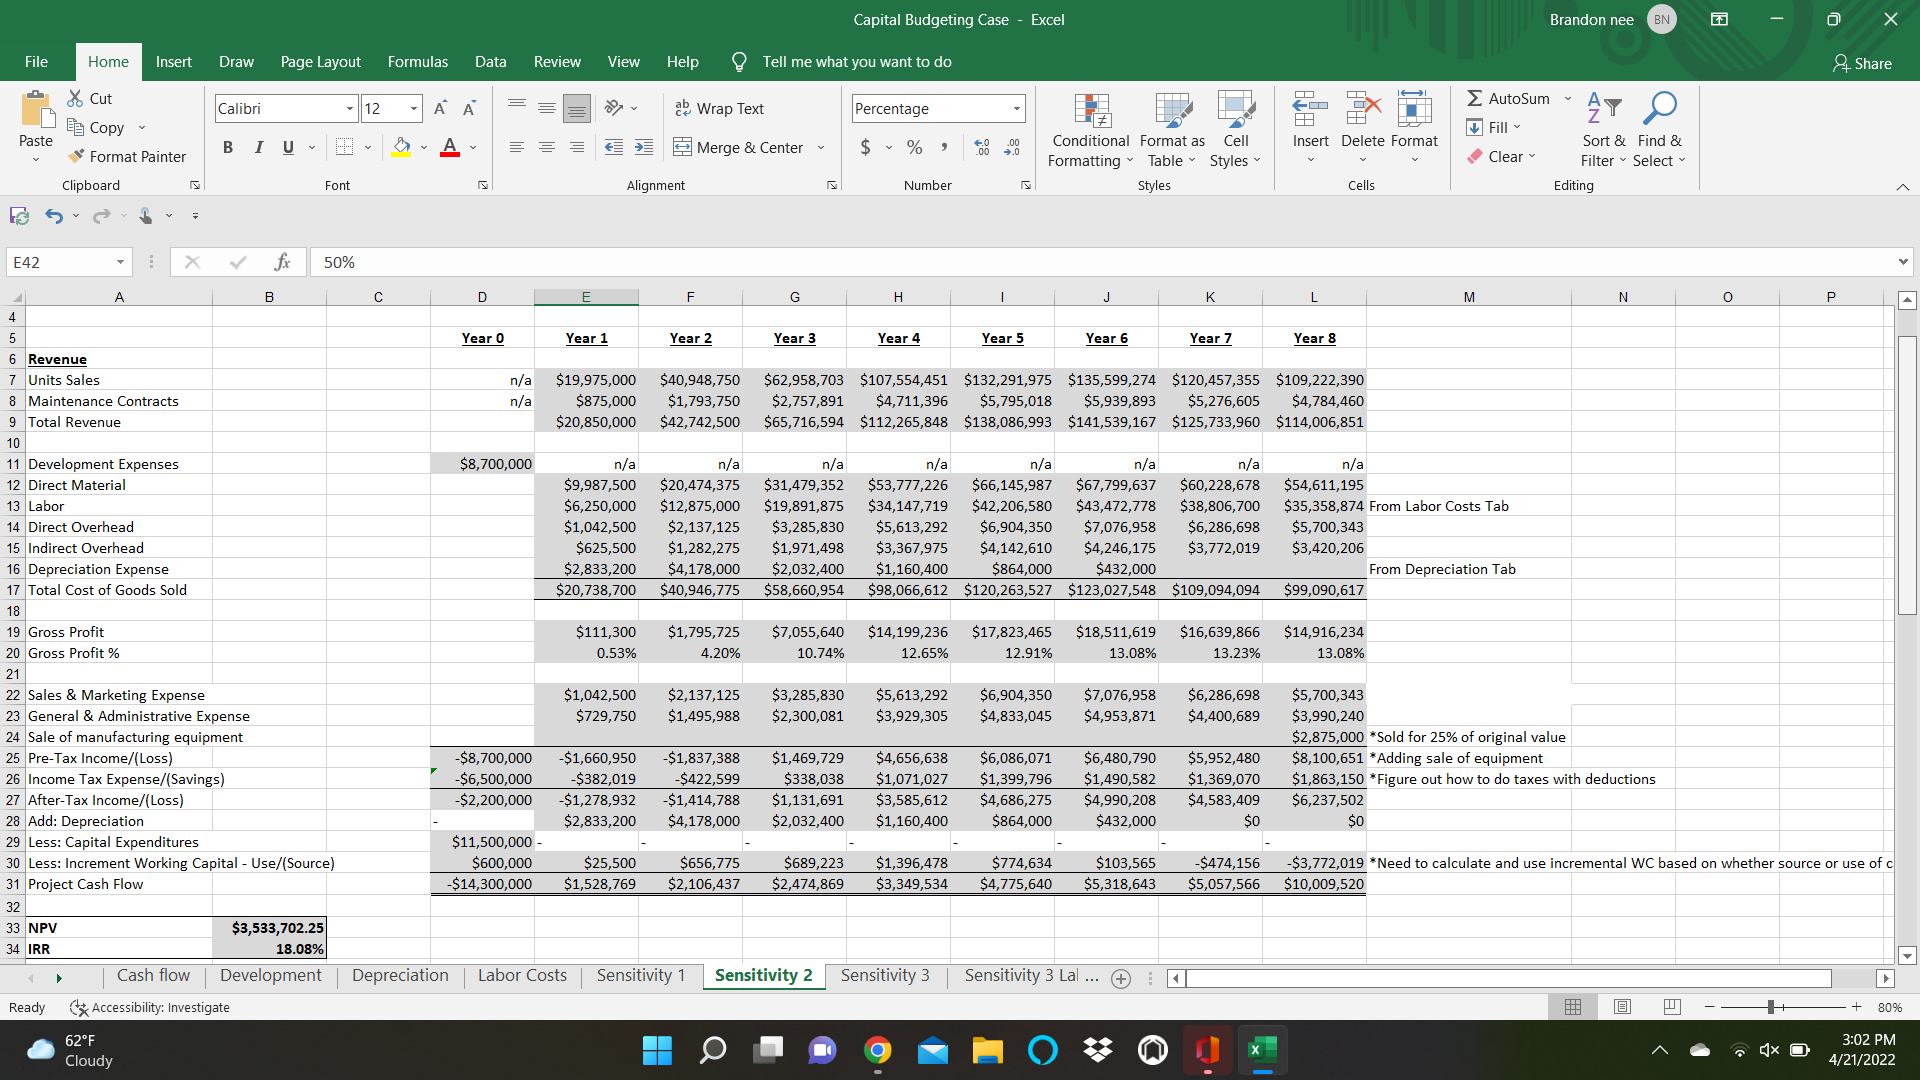
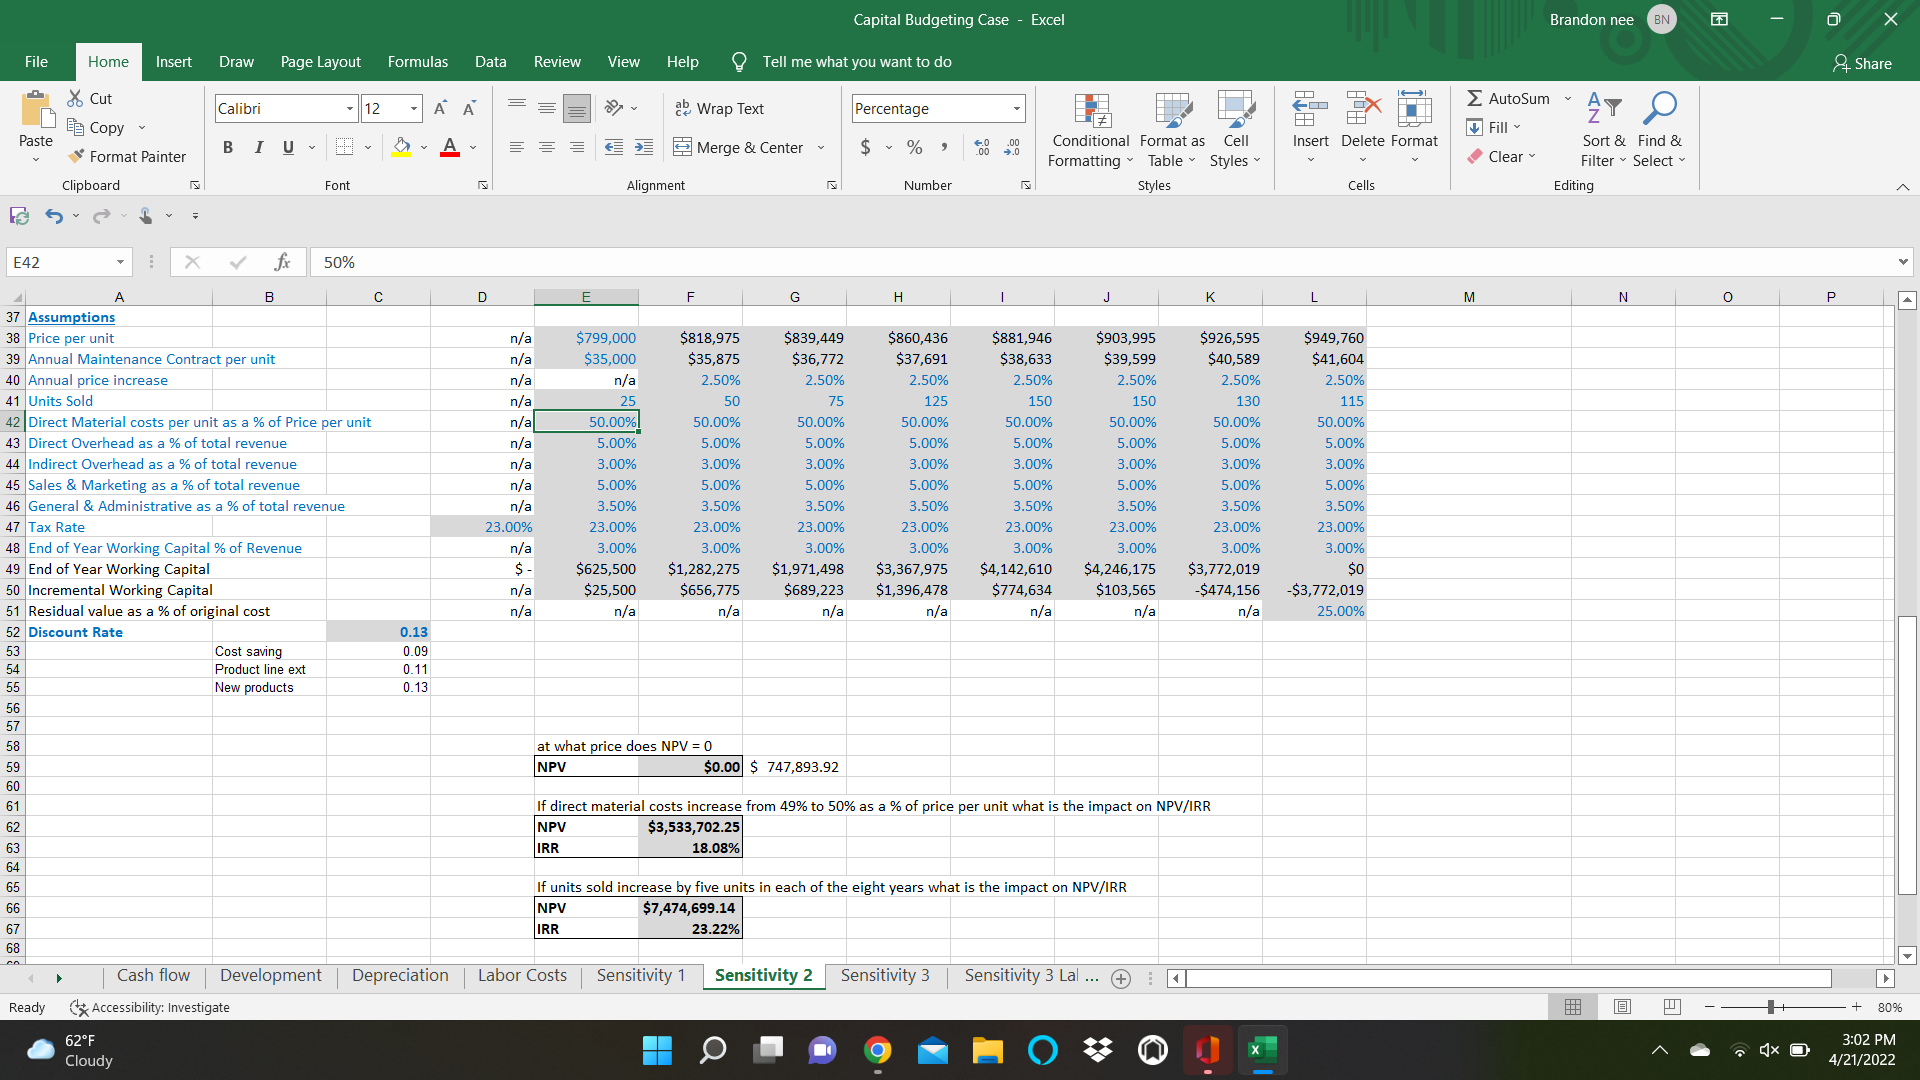
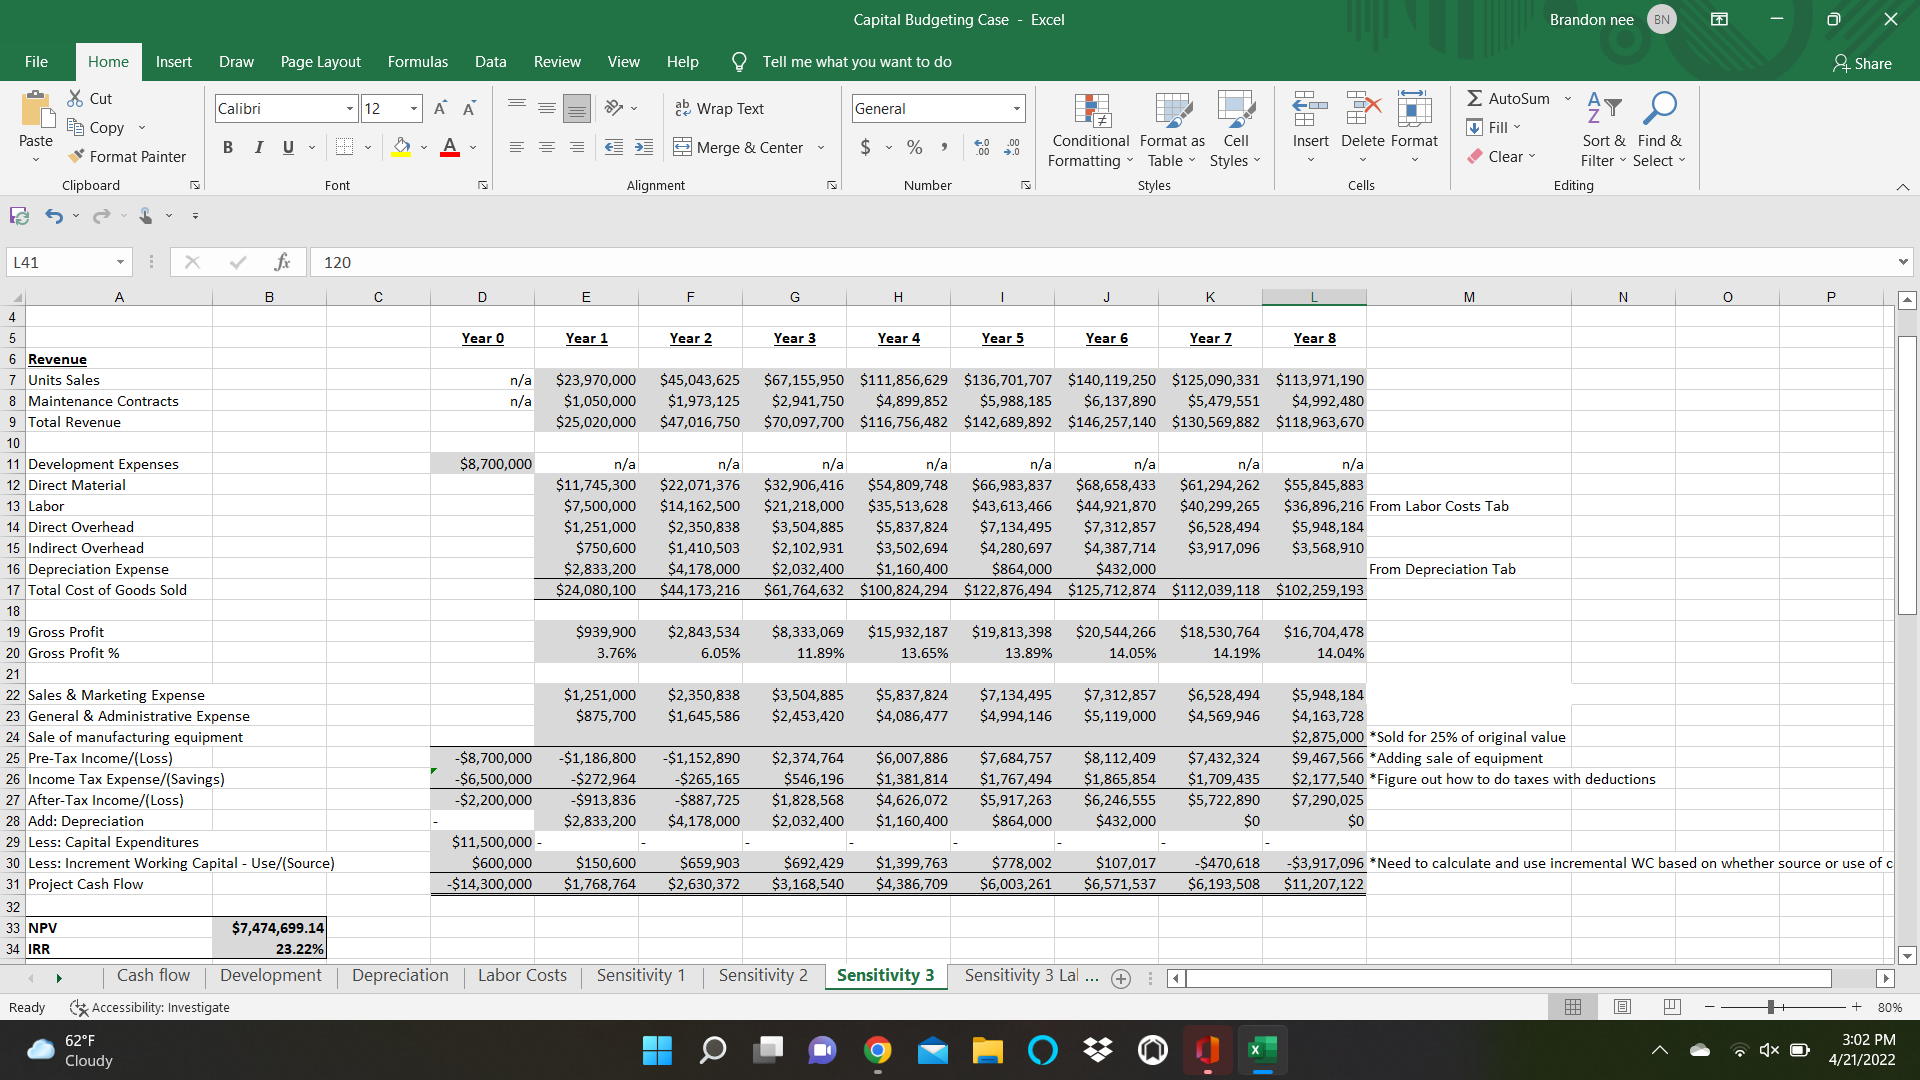
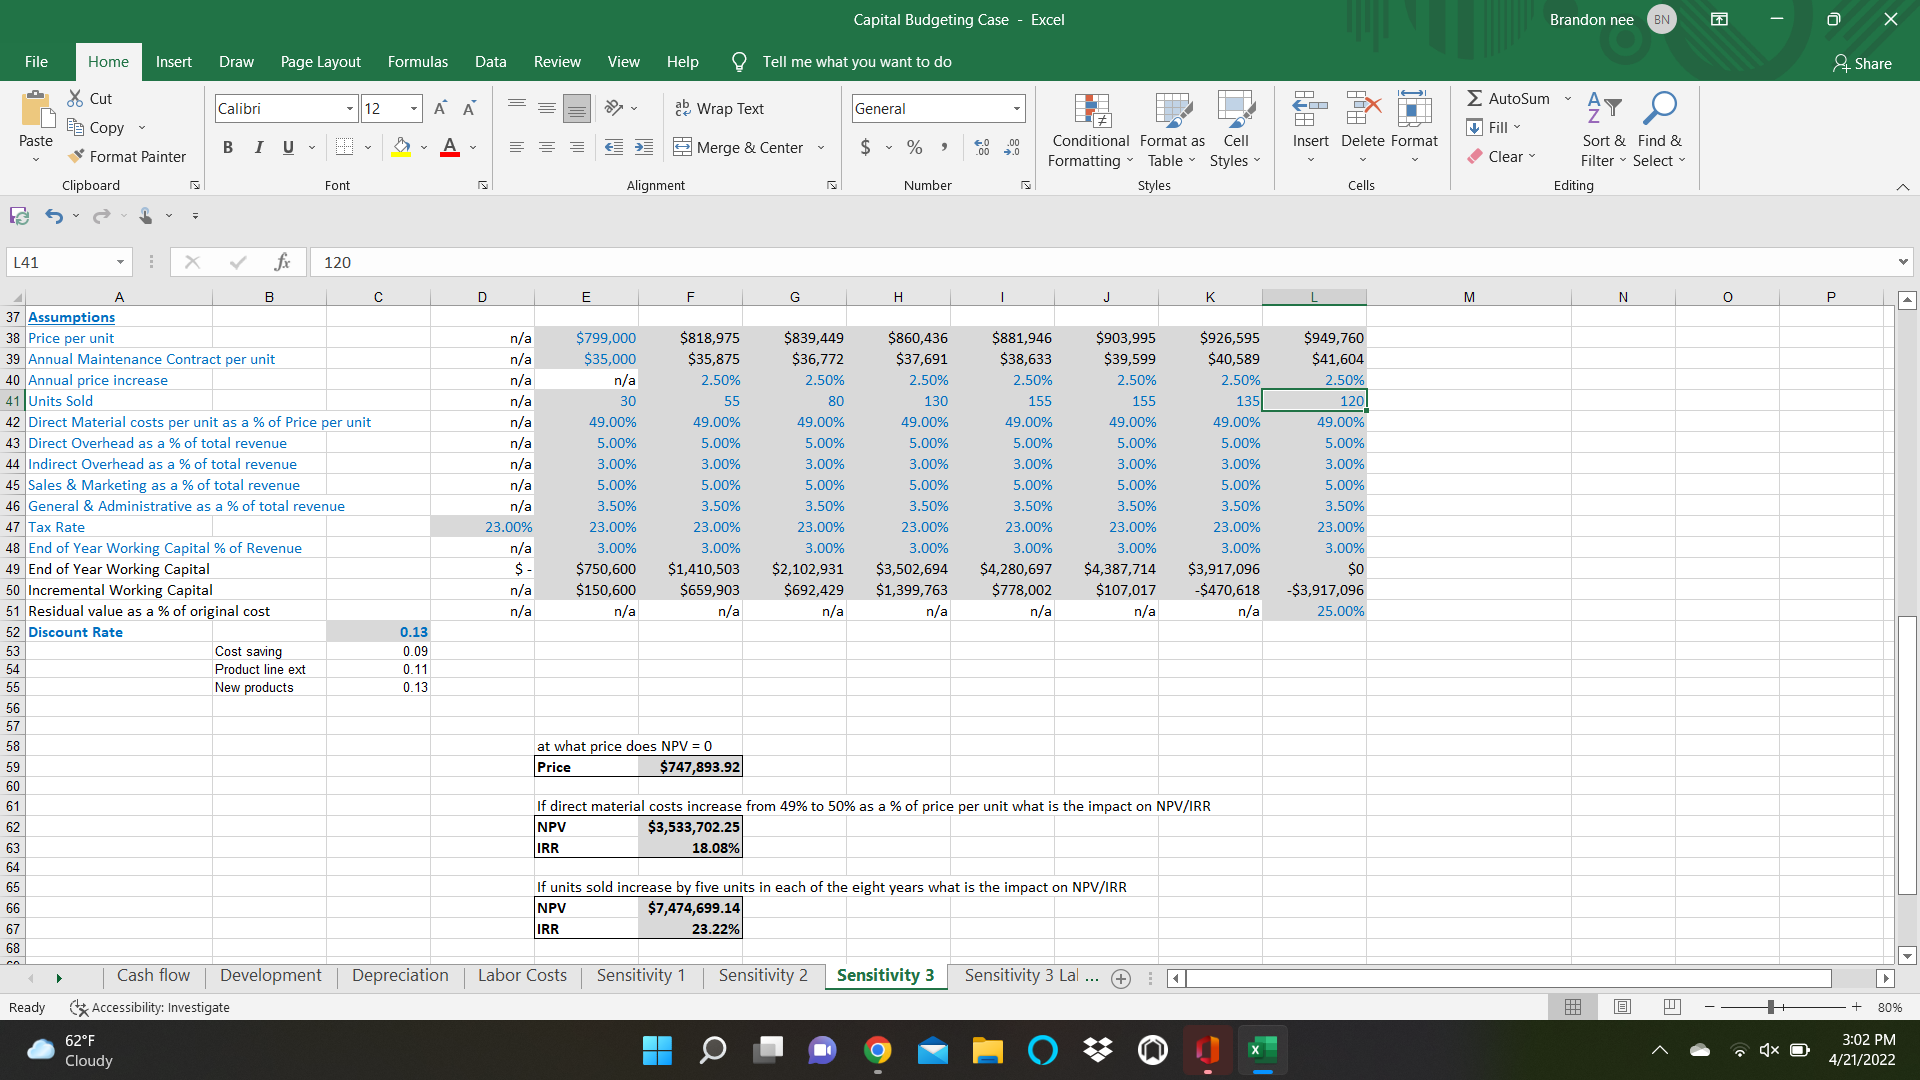
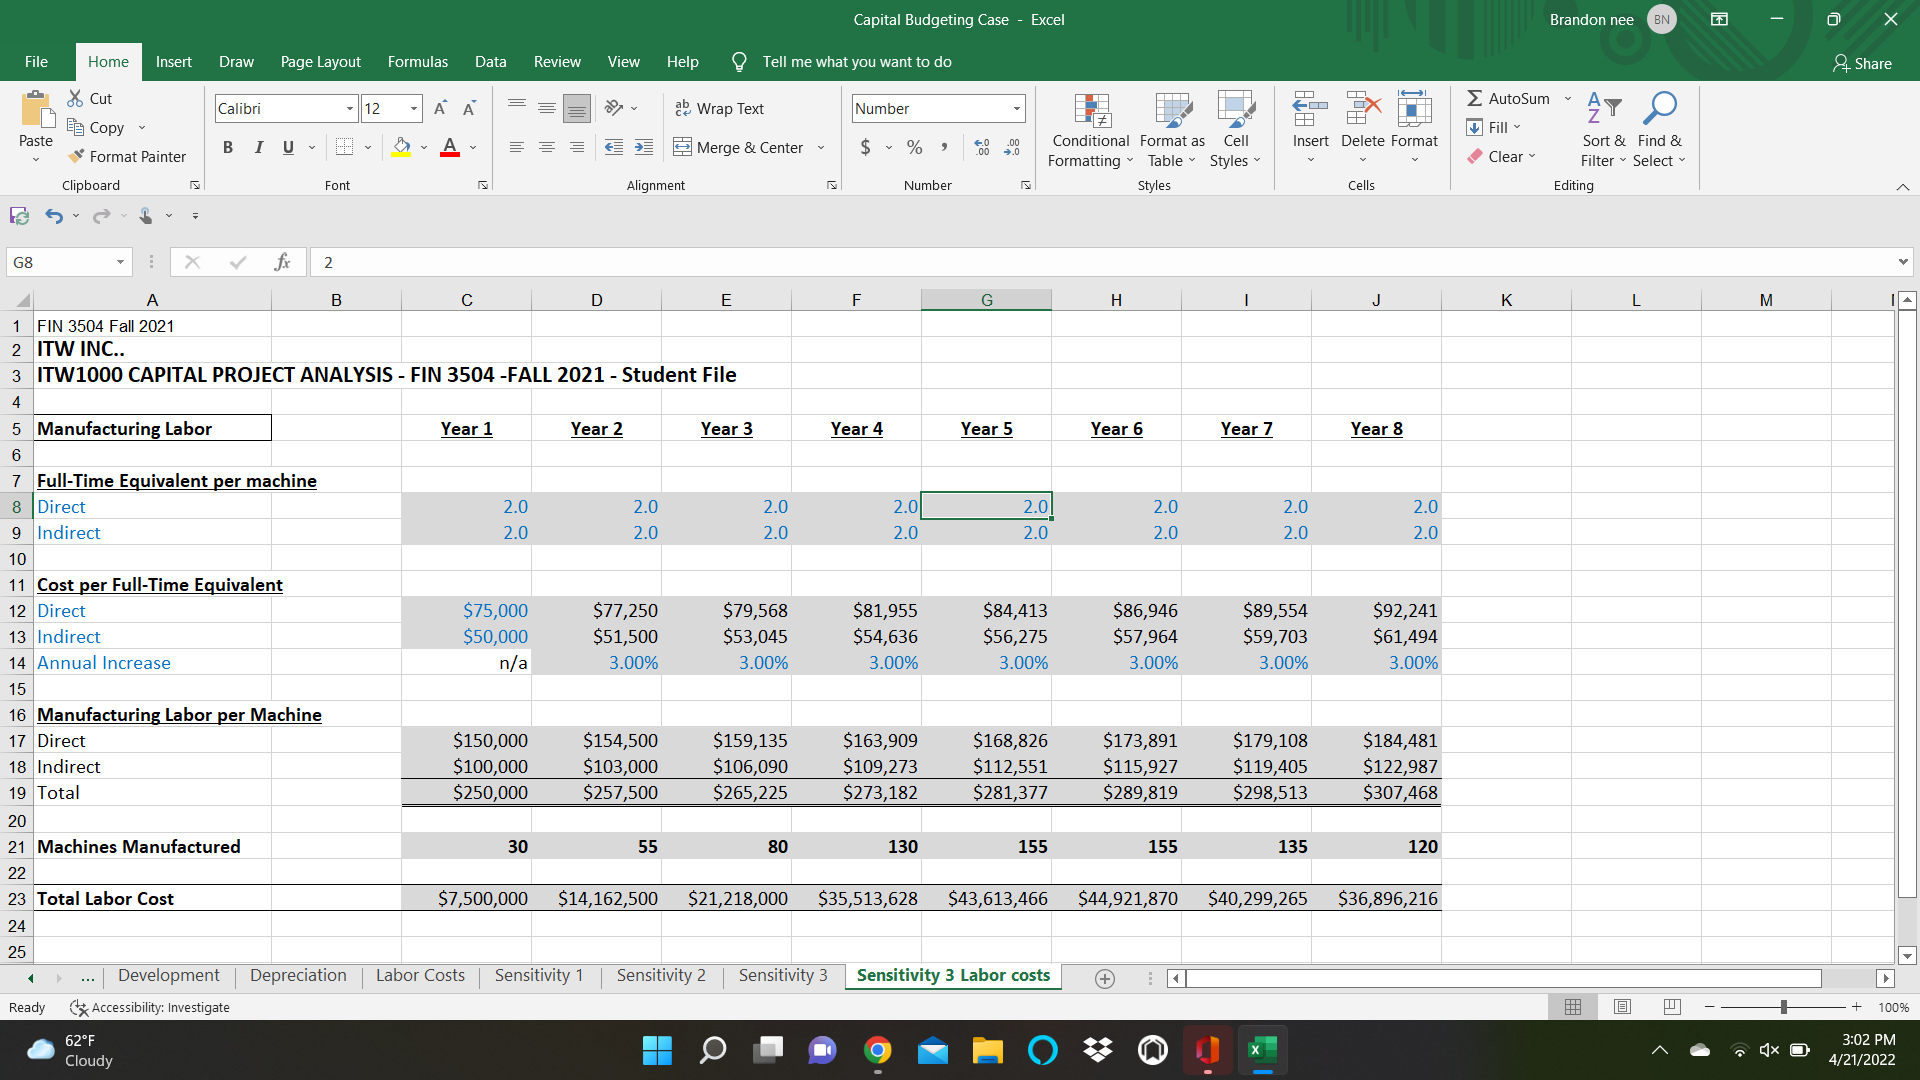
The committee requires a written report with supporting Excelanalyses which should include: Overview of the project Key factors in the packaging equipment market and packaged food & beverage industry Preparation of a dynamic (i.e. formulas should be linked to assumptions) project forecastmodel in Excel NPV and IRR analyses The following three sensitivity analyses need to be performed to the base case analysis:1. At what price per unit does the NPV equal zero (use "Goal Seek" under "Data","What-if", "Goal Seek")2. If direct material costs increase from 49% to 50% as a % of price per unit what isthe impact on NPV/IRR3. If units sold increase by five units in each of the eight years what is the impact onNPV/IRR Explanation of your results and recommend whether to accept or reject the project andoutline any risks/opportunities associated with the project that could impact the NPV/IRR
Capital Budgeting Case - Excel Brandon nee BN X File Home Insert Draw Page Layout Formulas Data Review View Help Tell me what you want to do Share f Cut = EX AutoSum ~ Calibri - 12 - A A al Wrap Text Currency AY O Copy Fill Sort & Find & Paste BIULA = Merge & Center $ % " Conditional Format as Cell Insert Delete Format Clear Format Painter Formatting " Table . Styles Filter ~ Select Font Alignment Number Styles Cells Editing Clipboard F13 X v fx ='Labor Costs'!D23 E F G H K M N P Q R S 1 FIN 3504 Fall 2021 2 ITW INC.. 3 ITW1000 CAPITAL PROJECT ANALYSIS - FIN 3504 -FALL 2021 - Student File 4 5 Year Year 1 Year 2 Year 3 Year 4 Year 5 Year 6 Year 7 Year 8 6 Revenue 7 Units Sales n/a $19,975,000 $40,948, 750 $62,958,703 $107,554,451 $132,291,975 $135,599,274 $120,457,355 $109,222,390 8 Maintenance Contracts n/a $875,000 $1,793,750 $2,757,891 $4,711,396 $5,795,018 $5,939,893 $5,276,605 $4,784,460 9 Total Revenue $20,850,000 $42,742,500 $65,716,594 $112,265,848 $138,086,993 $141,539,167 $125,733,960 $114,006,851 10 11 Development Expenses $8,700,000 n/a n/a na na n/a na n/a n/a 12 Direct Material $9,787,750 $20,064,888 $30,849,765 $52,701,681 $64,823,068 $66,443,644 $59,024,104 $53,518,971 13 Labor $6,250,000 $12,875,0001 $19,891,875 $34,147,719 $42,206,580 $43,472,778 $38,806, 700 $35,358,874 From Labor Costs Tab 14 Direct Overhead $1,042,500 $2,137,125 $3,285,830 $5,613,292 $6,904,350 $7,076,958 $6,286, 698 $5,700,343 15 Indirect Overhead $625,500 $1,282,275 $1,971,498 $3,367,975 $4,142,610 $4,246,175 $3,772,019 $3,420,206 16 Depreciation Expense $2,833,200 $4,178,000 $2,032,400 $1,160,400 $864,000 $432,00 From Depreciation Tab 17 Total Cost of Goods Sold $20,538,950 $40,537,288 $58,031,367 $96,991,068 $118,940,608 $121,671,556 $107,889,521 $97,998,393 18 19 Gross Profit $311,050 $2,205,213 $7,685,227 $15,274,780 $19,146,385 $19,867,612 $17,844,440 $16,008,458 20 Gross Profit % 1.49% 5.16% 11.69% 13.61% 13.87% 14.04% 14.19% 14.04% 21 22 Sales & Marketing Expense $1,042,500 $2,137,125 $3,285,830 $5,613,292 $6,904,350 $7,076,958 $6,286,698 $5,700,343 23 General & Administrative Expense $729,750 $1,495,988 $2,300,081 $3,929,305 $4,833,045 $4,953,871 $4,400,689 $3,990,240 24 Sale of manufacturing equipment $2,875,000 *Sold for 25% of original value 25 Pre-Tax Income/(Loss) $8,700,000 $1,461,200 -$1,427,900 $2,099,316 $5,732,183 $7,408,991 $7,836,783 $7,157,053 $9,192,875 #Adding sale of equipment 26 Income Tax Expense/(Savings) -$6,500,00 $336,076 -$328,417 $482,843 $1,318,402 $1,704,068 $1,802,460 $1,646,122 $2,114,361 *Figure out how to do taxes with deductions 27 After-Tax Income/(Loss) $2,200,000 $1,125,124 $1,099,483 $1,616,474 $4,413,781 $5,704,923 $6,034,323 $5,510,931 $7,078,514 28 Add: Depreciation $2,833,200 $4,178,000 $2,032,400 $1, 160,400 $864,000 $432,000 SO SO 29 Less: Capital Expenditures $11,500,000 30 Less: Increment Working Capital - Use/(Source) $600,000 $25,500 $656,775 $689,223 $1,396,478 $774,634 $103,565 -$474,156 -$3,772,019 *Need to calculate and use incremental WC based on whether source or use of cash 31 Project Cash Flow $14,300,000 $1,682,576 $2,421,742 $2,959,651 $4, 177,703 $5,794,289 $6,362,757 $5,985,087 $10,850,533 32 33 NPV $6,525,652.41 34 IRR 21.99% 35 36 27 Assumptions Cash flow Development Depreciation Labor Costs Sensitivity 1 Sensitivity 2 Sensitivity 3 Sensitivity 3 Lal ... + + 70% Ready * Accessibility: Investigate 3:01 PM 62.F O X O 4/21/2022 CloudyCapital Budgeting Case - Excel Brandon nee BN X File Draw Page Layout Formulas Data Help Tell me what you want to do Share Home Insert Review View EX AutoSum ~ f Cut Calibri - 12 - A A = al Wrap Text Currency AY O Fill Copy Sort & Find & Paste BIULA = Merge & Center $ % " Conditional Format as Cell Insert Delete Format Formatting Table . Styles Clear Filter ~ Select Format Painter Cells Editing Clipboard Font Alignment Number Styles F13 X v fx ='Labor Costs'!D23 B E F G H K M N P Q R S 34 IRR 21.99% 35 36 $7 Assumptions $799,000 $818,975 $839,449 $860,436 $881,946 $903,995 $926,595 $949,760 38 Price per unit n/a $38,633 $39,599 $40,589 $41,604 39 Annual Maintenance Contract per unit n/a $35,000 $35,875 $36,772 $37,691 n/a n/a 2.50% 2.50% 2.50% 2.50% 2.50% 2.50% 2.50% 40 Annual price increase 41 Units Sold n/a 25 50 75 125 150 150 130 115 49.00% 49.00% 49.00% 42 Direct Material costs per unit as a % of Price per unit n/a 49.00% 49.00% 49.00% 49.00% 49.00% n/a S.00% 5.00% 5.00% 5.00% 5.00% 5.00% 5.00% 5.00% 43 Direct Overhead as a % of total revenue 44 Indirect Overhead as a % of total revenue n/a 3.00% 3.009 3.009 3.009 3.00% 3.00% 3.00% 3.00% 5.00% 5.00% 5.00% 45 Sales & Marketing as a % of total revenue na 5.00% 5.00% 5.00% 5.00% 5.00% n/a 3.50% 3.50% 3.50% 3.509% 3.509 46 General & Administrative as a % of total revenue 3.50% 3.50 3.50 47 Tax Rate 23.00% 23.009% 23.009 23.00% 23.00% 23.00% 23.00% 23.00% 23.00% 48 End of Year Working Capital % of Revenue n/a 3.009 3.00% 3.00% 3.00% 3.00% 3.00% 3.00% 3.00% 49 End of Year Working Capital S - $625,500 $1,282,275 $1,971,498 $3,367,975 $4, 142,610 $4,246,175 $3, 772,019 SO 50 Incremental Working Capital n/a $25,500 $656, 775 $689,223 $1,396,478 $774,634 $103,565 -$474,156 -$3,772,019 51 Residual value as a % of original cost n/a n/a n/a n/a n/a n/a n/a n/a 25.00% 2 Discount Rate 0.13 53 Cost saving 0.09 54 Product line ext 0.11 55 New products 0.13 56 57 58 at what price does NPV = 0 59 NPV $0.00 $ 747,893.92 60 If direct material costs increase from 49% to 50% as a % of price per unit what is the impact on NPV/IRR NPV $3,533,702.25 IRR 18.08% If units sold increase by five units in each of the eight years what is the impact on NPV/IRR 8 898 828 89 NPV $7,474,699.14 IRR 23.22% Cash flow Development Depreciation Labor Costs Sensitivity 1 Sensitivity 2 Sensitivity 3 Sensitivity 3 Lal ... + + 70% Ready * Accessibility: Investigate 3:02 PM 62F O X O 4/21/2022 CloudyCapital Budgeting Case - Excel Brandon nee BN X File Home Insert Draw Page Layout Formulas Data Review View Help Tell me what you want to do Share f Cut Arial - 10 - A A = al Wrap Text General EX AutoSum ~ AY O Copy Fill Paste Format Painter BIULA = Merge & Center $ ~ % " Conditional Format as Cell Insert Delete Format Sort & Find & Formatting " Table " Styles Clear Filter ~ Select Clipboard Font Alignment Number Styles Cells Editing A1 : X FIN 3504 Fall 2021 B C D E F G H J K M FIN 3504 Fall 2021 2 ITW INC.. ITW1000 CAPITAL PROJECT ANALYSIS - FIN 3504 -FALL 2021 - Student File 4 5 Development Expenditures $11,500,000 6 Year 0 8 Expenses 9 Manufacturing $4,000,000 *tax deductible 10 Engineering $1,750,000 *tax deductible 11 General and administrative $500,000 *tax deductible 12 Test locations transportation/installation $250,000 *tax deductible 13 Sales and marketing $2,200,000 14 Total $8,700,000 15 16 Capital Expenditures 17 Manufacturing equipment (3 year MACRS) $4,000,000 18 Manufacturing equipment (5 year MACRS) $7,500,000 19 20 Working Capital 21 Initial funding $600,000 22 23 24 25 Cash flow Development Depreciation Labor Costs Sensitivity 1 Sensitivity 2 Sensitivity 3 Sensitivity 3 Lal ... + Ready Accessibility: Investigate + + 100% 62F 3:02 PM O X O Cloudy 4/21/2022Capital Budgeting Case - Excel Brandon nee BN X File Home Insert Draw Page Layout Formulas Data Review View Help Tell me what you want to do Share f Cut Arial - 10 - A A = al Wrap Text General EX AutoSum ~ AY O Copy Fill Paste BIULA = Merge & Center $ ~ % " Conditional Format as Cell Insert Delete Format Sort & Find & Format Painter Formatting " Table " Styles Clear Filter ~ Select Clipboard Font Alignment Number Styles Cells Editing A1 : X fx FIN 3504 Fall 2021 B C D E F G H J K M FIN 3504 Fall 2021 2 ITW INC.. 3 ITW1000 CAPITAL PROJECT ANALYSIS - FIN 3504 -FALL 2021 - Student File 5 MACRS Depreciation Year 1 Year 2 Year 3 Year 4 Year 5 Year 6 9 Capital Expenditures 10 Manufacturing equipment (3 year MACRS) $4,000,000 11 Manufacturing equipment (5 year MACRS) $7,500,000 12 13 Depreciation MACRS rates 14 3 year MACRS rates 33.33% 44.45% 14.81% 7.41% 15 5 year MACRS rates 20.00% 32.00% 19.20% 11.52% 11.52% 5.76% 16 17 Depreciation expense 18 3 year property $1,333,200 $1,778,000 $592,400 $296,400 SO SO 19 5 year property $1,500,000 $2,400,000 $1,440,000 $864,000 $864,000 $432,000 20 Total $2,833,200 $4,178,000 $2,032,400 $1,160,400 $864,000 $432,000 21 22 23 24 25 Cash flow | Development Depreciation Labor Costs Sensitivity 1 Sensitivity 2 Sensitivity 3 Sensitivity 3 Lal ... + Ready Accessibility: Investigate + + 100% 62F 3:02 PM O X O Cloudy 4/21/2022Capital Budgeting Case - Excel Brandon nee BN X File Home Insert Draw Page Layout Formulas Data Review View Help Tell me what you want to do Share f Cut Arial - 10 - A A = al Wrap Text General EX AutoSum AY O Copy Fill Paste Cell Format Painter BIUA =Merge & Center $ ~ % " Conditional Format as Insert Delete Format Sort & Find & Formatting " Table " Styles Clear Filter ~ Select Clipboard Font Alignment N Number Styles Cells Editing F34 X Y fix A B C D E F G H J K M 1 FIN 3504 Fall 2021 2 ITW INC.. ITW1000 CAPITAL PROJECT ANALYSIS - FIN 3504 -FALL 2021 - Student File 5 Manufacturing Labor Year 1 Year 2 Year 3 Year 4 Year 5 Year 6 Year 7 Year 8 6 7 Full-Time Equivalent per machine 8 Direct 2.0 2.0 2.0 2.0 2.0 2.0 2.0 2.0 Indirect 2.0 2.0 2.0 2.0 2.0 2.0 2.0 2.0 10 11 Cost per Full-Time Equivalent 12 Direct $75,000 $77,250 $79,568 $81,955 $84,413 $86,946 $89,554 $92,241 13 Indirect $50,000 $51,500 $53,045 $54,636 $56,275 $57,964 $59,703 $61,494 14 Annual Increase n/a 3.00% 3.00% 3.00% 3.00% 3.00% 3.00% 3.00% 15 16 Manufacturing Labor per Machine 17 Direct $150,000 $154,500 $159,135 $163,909 $168,826 $173,891 $179,108 $184,481 18 Indirect $100,000 $103,000 $106,090 $109,273 $112,551 $115,927 $119,405 $122,987 19 Total $250,000 $257,500 $265,225 $273,182 $281,377 $289,819 $298,513 $307,468 20 21 Machines Manufactured 25 50 75 125 150 150 130 115 22 23 Total Labor Cost $6,250,000 $12,875,000 $19,891,875 $34,147,719 $42,206,580 $43,472,778 $38,806,700 $35,358,874 24 25 Cash flow | Development Depreciation Labor Costs Sensitivity 1 Sensitivity 2 Sensitivity 3 Sensitivity 3 Lal ... + Ready * Accessibility: Investigate + + 100% 62.F O O 3:02 PM X O Cloudy O 4/21/2022Capital Budgeting Case - Excel Brandon nee BN X File Home Insert Draw Page Layout Formulas Data Review View Help Tell me what you want to do Share f Cut Calibri - 12 - A A" = al Wrap Text EX AutoSum ~ Currency AY O Copy Fill Paste = Merge & Center $ ~ % " Conditional Format as Cell Insert Delete Format Sort & Find & Format Painter BIULA Formatting " Table . Styles Clear Filter ~ Select Styles Cells Editing Clipboard Font Alignment Number B33 X fx {=NPV(C52,E31:L31)+D31} D E G H M N O P A B 5 Year 0 Year 1 Year 2 Year 3 Year 4 Year 5 Year 6 Year 7 Year 8 Revenue 7 Units Sales n/a $18,697,348 $38,329,563 $58,931,704 $100,674,994 $123,830,242 $126,925,999 $112,752,595 $102,236,248 8 Maintenance Contracts n/a $875,000 $1,793,750 $2,757,891 $4,711,396 $5,795,018 $5,939,893 $5,276,605 $4,784,460 9 Total Revenue $19,572,348 $40,123,313 $61,689,594 $105,386,390 $129,625,260 $132,865,892 $118,029,200 $107,020,708 10 11 Development Expenses $8,700,000 n/a n/a n/a n/a n/a n/a n/a n/a 12 Direct Material $9,161,701 $18,781,486 $28,876,535 $49,330,747 $60,676,819 $62,193,739 $55,248,772 $50,095,761 13 Labor $6,250,000 $12,875,000 $19,891,875 $34,147,719 $42,206,580 $43,472,778 $38,806,700 $35,358,874 From Labor Costs Tab 14 Direct Overhead $978,617 $2,006,166 $3,084,480 $5,269,320 $6,481,263 $6,643,295 $5,901,460 $5,351,035 15 Indirect Overhead $587,170 $1,203,699 $1,850,688 $3,161,592 $3,888,758 $3,985,977 $3,540,876 $3,210,621 16 Depreciation Expense $2,833,200 $4,178,000 $2,032,400 $1,160,400 $864,000 $432,000 From Depreciation Tab 17 Total Cost of Goods Sold $19,810,688 $39,044,351 $55,735,977 $93,069,777 $114,117,420 $116,727,788 $103,497, $94,016,292 18 19 Gross Profit $238,340 $1,078,962 $5,953,617 $12,316,613 $15,507,840 $16,138,103 $14,531,393 $13,004,416 20 Gross Profit % -1.22% 2.69% 9.65% 11.69% 11.96% 12.15% 12.31% 12.15% 21 22 Sales & Marketing Expense $978,617 $2,006,166 $3,084,480 $5,269,320 $6,481,263 $6,643,295 $5,901,460 $5,351,035 23 General & Administrative Expense $685,032 $1,404,316 $2,159,136 $3,688,524 $4,536,884 $4,650,306 $4,131,022 $3,745,725 24 Sale of manufacturing equipment $2,875,000 *Sold for 25% of original value 25 Pre-Tax Income/(Loss) -$8,700,000 $1,901,990 $2,331,519 $710,001 $3,358,770 $4,489,693 $4,844,502 $4,498,911 $6,782,656 *Adding sale of equipment 26 Income Tax Expense/(Savings) $6,500,000 $437,458 $536,249 $163,300 $772,517 $1,032,629 $1,114,236 $1,034,750 $1,560,011 *Figure out how to do taxes with deductions 27 After-Tax Income/(Loss) $2,200,000 $1,464,532 $1,795,270 $546,701 $2,586,253 $3,457,064 $3,730,267 $3,464,161 $5,222,645 SO 28 Add: Depreciation $2,833,200 $4,178,000 $2,032,400 $1,160,400 $864,000 $432,000 29 Less: Capital Expenditures $11,500,000 - 30 Less: Increment Working Capital - Use/(Source) $600,000 $12,830 $616,529 $646,988 $1,310,90 $727,166 $97,219 -$445,101 $3,540,876 *Need to calculate and use incremental WC based on whether source or use of c 31 Project Cash Flow -$14,300,000 $1,381,497 $1,766,201 $1,932,113 $2,435,749 $3,593,898 $4,065,048 $3,909,262 $8,763,521 32 33 NPV $0.00 34 IRR 13.00% Cash flow Development Depreciation Labor Costs Sensitivity 1 Sensitivity 2 Sensitivity 3 Sensitivity 3 Lal ... + -H + 80% Ready * Accessibility: Investigate 3:02 PM 62.F O O qx O 4/21/2022 CloudyCapital Budgeting Case - Excel Brandon nee BN X Share File Home Insert Draw Page Layout Formulas Data Review View Help Tell me what you want to do f Cut = EX AutoSum ~ Calibri - 12 - A A" al Wrap Text Currency AY O Copy Fill Sort & Find & Paste BIULA = Merge & Center $ ~ % " Conditional Format as Cell Insert Delete Format Clear Format Painter Formatting " Table . Styles Filter ~ Select Cells Editing Clipboard Font Alignment Number Styles B33 X V fx {=NPV(C52,E31:L31)+D31} O P B D E G H M N 37 Assumptions n/a $747,894 $766,591 $785,756 $805,400 $825,535 $846,173 $867,328 $889,011 38 Price per unit Annual Maintenance Contract per unit n/a $35,000 $35,875 $36,772 $37,691 $38,633 $39,599 $40,589 $41,604 40 Annual price increase n/a n/a 2.50% 2.50% 2.50% 2.50% 2.50% 2.50% 2.50% 41 Units Sold n/a 25 50 75 125 150 150 130 115 42 Direct Material costs per unit as a % of Price per unit n/a 49.00% 49.00% 49.00% 49.00% 49.00% 49.00% 49.00% 49.00% 43 Direct Overhead as a % of total revenue n/a 5.00% 5.00% 5.00% 5.00% 5.00% 5.00% 5.00% 5.00% 44 Indirect Overhead as a % of total revenue na 3.00% 3.00% 3.00% 3.00% 3.00% 3.00% 3.00% 3.00% 45 Sales & Marketing as a % of total revenue n/a 5.00% 5.00% 5.00% 5.00% 5.00% 5.00% 5.00% 5.00% 46 General & Administrative as a % of total revenue n/a 3.50% 3.50% 3.50% 3.50% 3.50% 3.50% 3.50% 3.50% 47 Tax Rate 23.00% 23.00% 23.00% 23.00% 23.00% 23.00% 23.00% 23.00% 23.00% 48 End of Year Working Capital % of Revenue n/a 3.00% 3.00% 3.00% 3.00% 3.00% 3.00% 3.00% 3.00% $ - $587,170 $1,203,699 $1,850,688 $3,161,592 $3,985,977 $3,540,876 SO 49 End of Year Working Capital $3,888,758 50 Incremental Working Capital n/a -$12,830 $616,529 $646,988 $1,310,904 $727,166 $97,219 -$445,101 -$3,540,876 51 Residual value as a % of original cost n/a n/a n/a na n/a n/a n/a n/a 25.00% 52 Discount Rate 0.13 53 Cost saving 0.09 Product line ext 0.11 55 New products 0.13 56 57 58 at what price does NPV = 0 NPV $0.00 $ 747,893.92 If direct material costs increase from 49% to 50% as a % of price per unit what is the impact on NPV/IRR NPV $3,533,702.25 IRR 18.08% If units sold increase by five units in each of the eight years what is the impact on NPV/IRR NP $7,474,699.14 IRR 23.22% Cash flow Development Depreciation Labor Costs Sensitivity 1 Sensitivity 2 Sensitivity 3 Sensitivity 3 Lal ... + H + 80% Ready * Accessibility: Investigate 3:02 PM 62F O X O 4/21/2022 CloudyCapital Budgeting Case - Excel Brandon nee BN X File Home Insert Draw Page Layout Formulas Data Review View Help Tell me what you want to do Share f Cut AutoSum ~ Calibri al Wrap Text EX - 12 - A A = Percentage AY O Copy Fill Conditional Format as Cell Insert Delete Format Sort & Find & Paste BIULA Merge & Center $ ~ % " Format Painter Formatting " Table . Styles Clear Filter ~ Select Editing Clipboard Font Alignment Number Styles Cells E42 X Y 50% C D G H M N O P A B 5 Year 0 Year 1 Year 2 Year 3 Year 4 Year 5 Year 6 Year 7 Year 8 Revenue 7 Units Sales n/a $19,975,000 $40,948,750 $62,958,703 $107,554,451 $132,291,975 $135,599,274 $120,457,355 $109,222,390 8 Maintenance Contracts n/a $875,000 $1,793,750 $2,757,891 $4,711,396 $5,795,018 $5,939,893 $5,276,605 $4,784,460 9 Total Revenue $20,850,000 $42,742,500 $65,716,594 $112,265,848 $138,086,993 $141,539,167 $125,733,960 $114,006,851 10 11 Development Expenses $8,700,000 n/a n/a n/a n/a n/a n/a n/a n/a 12 Direct Material $9,987,500 $20,474,375 $31,479,352 $53,777,226 $66,145,987 $67,799,637 $60,228,678 $54,611,195 13 Labor $6,250,000 $12,875,000 $19,891,875 $34,147,719 $42,206,580 $43,472,778 $38,806,700 $35,358,874 From Labor Costs Tab 14 Direct Overhead $1,042,500 $2,137,125 $3,285,830 $5,613,292 $6,904,350 $7,076,958 $6,286,698 $5,700,343 15 Indirect Overhead $625,500 $1,282,275 $1,971,498 $3,367,975 $4,142,610 $4,246,175 $3,772,019 $3,420,206 $2,833,200 $4,178,000 $2,032,400 $1,160,400 $864,000 $432,000 From Depreciation Tab 16 Depreciation Expense 17 Total Cost of Goods Sold $20,738,700 $40,946,775 $58,660,954 $98,066,612 $120,263,527 $123,027,548 $109,094,09 $99,090,617 18 19 Gross Profit $111,300 $1,795,725 $7,055,640 $14,199,236 $17,823,465 $18,511,619 $16,639,866 $14,916,234 20 Gross Profit % 0.53% 4.20% 10.74% 12.65% 12.91% 13.08% 13.23% 13.08% 21 22 Sales & Marketing Expense $1,042,500 $2,137,125 $3,285,830 $5,613,292 $6,904,350 $7,076,958 $6,286,698 $5,700,343 23 General & Administrative Expense $729,750 $1,495,988 $2,300,081 $3,929,305 $4,833,045 $4,953,871 $4,400,689 $3,990,240 24 Sale of manufacturing equipment $2,875,000 *Sold for 25% of original value 25 Pre-Tax Income/(Loss) -$8,700,000 $1,660,950 $1,837,388 $1,469,729 $4,656,638 $6,086,071 $6,480,790 $5,952,480 $8,100,651 *Adding sale of equipment 26 Income Tax Expense/(Savings) $6,500,000 $382,019 -$422,599 $338,038 $1,071,027 $1,399,796 $1,490,582 $1,369,070 $1,863,150 *Figure out how to do taxes with deductions 27 After-Tax Income/(Loss) $2,200,000 $1,278,932 $1,414,788 $1,131,691 $3,585,612 $4,686,275 $4,990,208 $4,583,409 $6,237,502 28 Add: Depreciation $2,833,200 $4,178,000 $2,032,400 $1,160,400 $864,000 $432,000 SO 29 Less: Capital Expenditures $11,500,000 - 30 Less: Increment Working Capital - Use/(Source) $600,000 $25,500 $656,775 $689,223 $1,396,478 $774,634 $103,565 $474,156 -$3,772,019 *Need to calculate and use incremental WC based on whether source or use of c 31 Project Cash Flow -$14,300,000 $1,528,769 $2,106,437 $2,474,869 $3,349,534 $4,775,640 $5,318,643 $5,057,566 $10,009,520 32 33 NPV $3,533,702.25 34 IRR 18.08% Cash flow Development Depreciation Labor Costs Sensitivity 1 Sensitivity 2 Sensitivity 3 Sensitivity 3 Lal ... + -H + 80% Ready * Accessibility: Investigate 3:02 PM 62.F O O O qx O 4/21/2022 CloudyCapital Budgeting Case - Excel Brandon nee BN X File Home Insert Draw Page Layout Formulas Data Review View Help Tell me what you want to do Share f Cut AutoSum ~ Calibri - 12 - A A = al Wrap Text EX Percentage AY O Copy Fill Merge & Center $ ~ % " Conditional Format as Cell Insert Delete Format Sort & Find & Paste Format Painter BIULA Formatting * Table * Styles Clear Filter ~ Select Editing Clipboard Font Alignment Number Styles Cells E42 X fix 50% P D H O B C E G M N 37 Assumptions 38 Price per unit n/a $799,000 $818,975 $839,449 $860,436 $881,946 $903,995 $926,595 $949,760 Annual Maintenance Contract per unit n/a $35,000 $35,875 $36,772 $37,691 $38,633 $39,599 $40,589 $41,604 40 Annual price increase n/a n/a 2.50% 2.50 2.50% 2.50% 2.50% 2.50% 2.50% n/a 25 50 75 125 150 150 130 115 41 Units Sold 42 Direct Material costs per unit as a % of Price per unit n/a 50.00%1 50.00% 50.00% 50.00% 50.00% 50.00% 50.00% 50.00% 43 Direct Overhead as a % of total revenue n/a 5.00% 5.00% 5.00% 5.00% 5.00% 5.00% 5.00% 5.00% 44 Indirect Overhead as a % of total revenue n/a 3.00% 3.00% 3.00% 3.00% 3.00% 3.00% 3.00% 3.00% 45 Sales & Marketing as a % of total revenue n/a 5.00% 5.00% 5.00% 5.00% 5.00% 5.00% 5.00% 5.00% 46 General & Administrative as a % of total revenue n/a 3.50% 3.50% 3.50% 3.50% 3.50% 3.50% 3.50% 3.50% 23.00% 23.00% 23.00% 23.00% 23.00% 23.00% 23.00% 47 Tax Rate 23.00% 23.00% 48 End of Year Working Capital % of Revenue n/a 3.00% 3.00% 3.00% 3.00% 3.00% 3.00% 3.00% 3.00% 49 End of Year Working Capital $ - $625,500 $1,282,275 $1,971,498 $3,367,975 $4,142,610 $4,246,175 $3,772,019 SO 50 Incremental Working Capital n/a $25,500 $656,775 $689,223 $1,396,478 $774,634 $103,565 -$474,156 -$3,772,019 51 Residual value as a % of original cost n/a na n/a n/a n/a n/a n/a n/a 25.00% 52 Discount Rate 0.13 53 Cost saving 0.09 Product line ext 0.11 55 New products 0.13 56 57 58 at what price does NPV = 0 NPV $0.00 $ 747,893.92 If direct material costs increase from 49% to 50% as a % of price per unit what is the impact on NPV/IRR NPV $3,533,702.25 IRR 18.08% If units sold increase by five units in each of the eight years what is the impact on NPV/IRR NP $7,474,699.14 IRR 23.22% Cash flow Development Depreciation Labor Costs Sensitivity 1 Sensitivity 2 Sensitivity 3 Sensitivity 3 Lal ... + H + 80% Ready * Accessibility: Investigate 3:02 PM 62F O X O 4/21/2022 CloudyCapital Budgeting Case - Excel Brandon nee BN X Share File Home Insert Draw Page Layout Formulas Data Review View Help Tell me what you want to do f Cut Calibri - 12 - A A = al Wrap Text EX AutoSum ~ General AY O Copy Fill Paste = Merge & Center $ ~ % " Conditional Format as Cell Insert Delete Format Sort & Find & Format Painter BIULA Formatting " Table . Styles Clear Filter ~ Select Clipboard Font Alignment Number Styles Cells Editing L41 X fix 120 O P A B C D E G H M N 5 Year 0 Year 1 Year 2 Year 3 Year 4 Year 5 Year 6 Year 7 Year 8 Revenue 7 Units Sales n/a $23,970,000 $45,043,625 $67,155,950 $111,856,629 $136,701,707 $140,119,250 $125,090,331 $113,971,190 8 Maintenance Contracts n/a $1,050,000 $1,973,125 $2,941,750 $4,899,852 $5,988,185 $6,137,890 $5,479,551 $4,992,480 9 Total Revenue $25,020,000 $47,016,750 $70,097,700 $116,756,482 $142,689,892 $146,257,140 $130,569,882 $118,963,670 10 11 Development Expenses $8,700,000 n/a n/a n/a n/a n/a n/a n/a n/a 12 Direct Material $11,745,300 $22,071,376 $32,906,416 $54,809,748 $66,983,837 $68,658,433 $61,294,262 $55,845,883 13 Labor $7,500,000 $14,162,500 $21,218,000 $35,513,628 $43,613,466 $44,921,870 $40,299,265 $36,896,216 From Labor Costs Tab 14 Direct Overhead $1,251,000 $2,350,838 $3,504,885 $5,837,824 $7,134,495 $7,312,857 $6,528,494 $5,948,184 15 Indirect Overhead $750,600 $1,410,503 $2,102,931 $3,502,694 $4,280,697 $4,387,714 $3,917,096 $3,568,910 16 Depreciation Expense $2,833,200 $4,178,000 $2,032,400 $1,160,400 $864,000 $432,000 From Depreciation Tab 17 Total Cost of Goods Sold $24,080,100 $44,173,216 $61,764,632 $100,824,294 $122,876,494 $125,712,874 $112,039,118 $102,259,193 18 19 Gross Profit $939,900 $2,843,534 $8,333,069 $15,932,187 $19,813,398 $20,544,266 $18,530,764 $16,704,478 20 Gross Profit % 3.76% 6.05% 11.89% 13.65% 13.89% 14.05% 14.19% 14.04% 21 22 Sales & Marketing Expense $1,251,000 $2,350,838 $3,504,885 $5,837,824 $7,134,495 $7,312,857 $6,528,494 $5,948,184 23 General & Administrative Expense $875,700 $1,645,586 $2,453,420 $4,086,477 $4,994,146 $5,119,000 $4,569,946 $4,163,728 24 Sale of manufacturing equipment $2,875,000 *Sold for 25% of original value 25 Pre-Tax Income/(Loss) -$8,700,000 $1,186,800 $1,152,890 $2,374,764 $6,007,886 $7,684,757 $8,112,409 $7,432,324 $9,467,566 *Adding sale of equipment 26 Income Tax Expense/(Savings) $6,500,000 $272,964 $265,165 $546,196 $1,381,814 $1,767,494 $1,865,854 $1,709,435 $2,177,540 *Figure out how to do taxes with deductions 27 After-Tax Income/(Loss) $2,200,000 $913,836 -$887,725 $1,828,568 $4,626,072 $5,917,263 $6,246,555 $5,722,890 $7,290,025 $2,833,200 $2,032,400 $1,160,400 $864,000 $432,000 SO 28 Add: Depreciation $4,178,000 SO 29 Less: Capital Expenditures $11,500,000 - 30 Less: Increment Working Capital - Use/(Source) $600,000 $150,600 $659,90 $692,429 $1,399,763 $778,002 $107,017 -$470,618 -$3,917,096 *Need to calculate and use incremental WC based on whether source or use of c 31 Project Cash Flow -$14,300,000 $1,768,764 $2,630,372 $3,168,540 $4,386,709 $6,003,261 $6,571,537 $6,193,508 $11,207,122 32 33 NPV $7,474,699.14 34 IRR 23.22% Cash flow Development Depreciation Labor Costs Sensitivity 1 Sensitivity 2 Sensitivity 3 Sensitivity 3 Lal ... + -H + 80% Ready * Accessibility: Investigate 3:02 PM 62.F O O qx O 4/21/2022 CloudyX Capital Budgeting Case - Excel Brandon nee BN Share File Home Insert Draw Page Layout Formulas Data Review View Help Tell me what you want to do EX AutoSum ~ f Cut Calibri - 12 - A A = al Wrap Text General AY O Fill Copy =Merge & Center $ ~ % " Conditional Format as Cell Insert Delete Format Sort & Find & Paste Formatting " Table . Styles Clear Filter ~ Select Format Painter BIULA Cells Editing Clipboard Font Alignment Number Styles L41 X fix 120 O P B C D E G H M N 37 Assumptions n/a $799,000 $818,975 $839,449 $860,436 $881,946 $903,995 $926,595 $949,760 38 Price per unit Annual Maintenance Contract per unit n/a $35,000 $35,875 $36,772 $37,691 $38,633 $39,599 $40,589 $41,604 n/a n/a 2.50% 2.50% 2.50% 2.50% 2.50% 2.50% 2.50% 40 Annual price increase 41 Units Sold n/a 30 55 80 130 155 155 135 120 42 Direct Material costs per unit as a % of Price per unit n/a 49.00% 49.00% 49.00% 49.00% 49.00% 49.00% 49.00% 49.00% n/a 5.00% 5.00% 5.00% 5.00% 5.00% 5.00% 5.00% 5.00% 43 Direct Overhead as a % of total revenue 3.00% 3.00% 3.00% 3.00% 3.00% 44 Indirect Overhead as a % of total revenue na 3.00% 3.00% 3.00% 45 Sales & Marketing as a % of total revenue n/a 5.00% 5.00% 5.00% 5.00% 5.00% 5.00% 5.00% 5.00% 46 General & Administrative as a % of total revenue n/a 3.50% 3.50% 3.50% 3.50% 3.50% 3.50% 3.50% 3.50% 47 Tax Rate 23.00% 23.00% 23.00% 23.00% 23.00% 23.00% 23.00% 23.00% 23.00% 48 End of Year Working Capital % of Revenue n/a 3.00% 3.00% 3.00% 3.00% 3.00% 3.00% 3.00% 3.00% $3,917,096 SO 49 End of Year Working Capital $ - $750,600 $1,410,503 $2,102,931 $3,502,694 $4,280,697 $4,387,714 -$470,618 -$3,917,096 50 Incremental Working Capital n/a $150,600 $659,90 $692,429 $1,399,763 $778,002 $107,017 51 Residual value as a % of original cost n/a na n/a n/a na n/a n/a n/a 25.00% 52 Discount Rate 0.13 53 Cost saving 0.09 Product line ext 0.11 55 New products 0.13 56 57 58 at what price does NPV = 0 Price $747,893.92 If direct material costs increase from 49% to 50% as a % of price per unit what is the impact on NPV/IRR NPV $3,533,702.25 IRR 18.08% If units sold increase by five units in each of the eight years what is the impact on NPV/IRR NP $7,474,699.14 IRR 23.22% Cash flow Development Depreciation Labor Costs Sensitivity 1 Sensitivity 2 Sensitivity 3 Sensitivity 3 Lal ... + H + 80% Ready * Accessibility: Investigate 3:02 PM 62F O O X O 4/21/2022 CloudyCapital Budgeting Case - Excel Brandon nee BN X File Home Insert Draw Page Layout Formulas Data Review View Help Tell me what you want to do Share f Cut Calibri - 12 - A A = al Wrap Text Number EX AutoSum AY O Copy Fill Paste BIULA =Merge & Center $ % " Conditional Format as Cell Insert Delete Format Sort & Find & Format Painter Formatting * Table . Styles Clear Filter ~ Select Clipboard Font Alignment Number Styles Cells Editing G8 : X fx 2 A B C D E F G H J K M 1 FIN 3504 Fall 2021 2 ITW INC.. ITW1000 CAPITAL PROJECT ANALYSIS - FIN 3504 -FALL 2021 - Student File 5 Manufacturing Labor Year 1 Year 2 Year 3 Year 4 Year 5 Year 6 Year 7 Year 8 6 7 Full-Time Equivalent per machine 8 Direct 2.0 2.0 2.0 2.0 2.0 2.0 2.0 2.0 9 Indirect 2.0 2.0 2.0 2.0 2.0 2.0 2.0 2.0 10 11 Cost per Full-Time Equivalent 12 Direct $75,000 $77,250 $79,568 $81,955 $84,413 $86,946 $89,554 $92,241 13 Indirect $50,000 $51,500 $53,045 $54,636 $56,275 $57,964 $59,703 $61,494 14 Annual Increase n/a 3.00% 3.00% 3.00% 3.00% 3.00% 3.00% 3.00% 15 16 Manufacturing Labor per Machine 17 Direct $150,000 $154,500 $159,135 $163,909 $168,826 $173,891 $179,108 $184,481 18 Indirect $100,000 $103,000 $106,090 $109,273 $112,551 $115,927 $119,405 $122,987 19 Total $250,000 $257,500 $265,225 $273,182 $281,377 $289,819 $298,513 $307,468 20 21 Machines Manufactured 30 55 80 130 155 155 135 120 22 23 Total Labor Cost $7,500,000 $14,162,500 $21,218,000 $35,513,628 $43,613,466 $44,921,870 $40,299,265 $36,896,216 24 25 ... Development Depreciation Labor Costs Sensitivity 1 Sensitivity 2 Sensitivity 3 Sensitivity 3 Labor costs + Ready Accessibility: Investigate + + 100% 62.F O O 3:02 PM X O Cloudy 4/21/2022
Step by Step Solution
There are 3 Steps involved in it
1 Expert Approved Answer
Step: 1 Unlock
Question Has Been Solved by an Expert!
Get step-by-step solutions from verified subject matter experts
Step: 2 Unlock
Step: 3 Unlock
Students Have Also Explored These Related Finance Questions!