please answer thew question
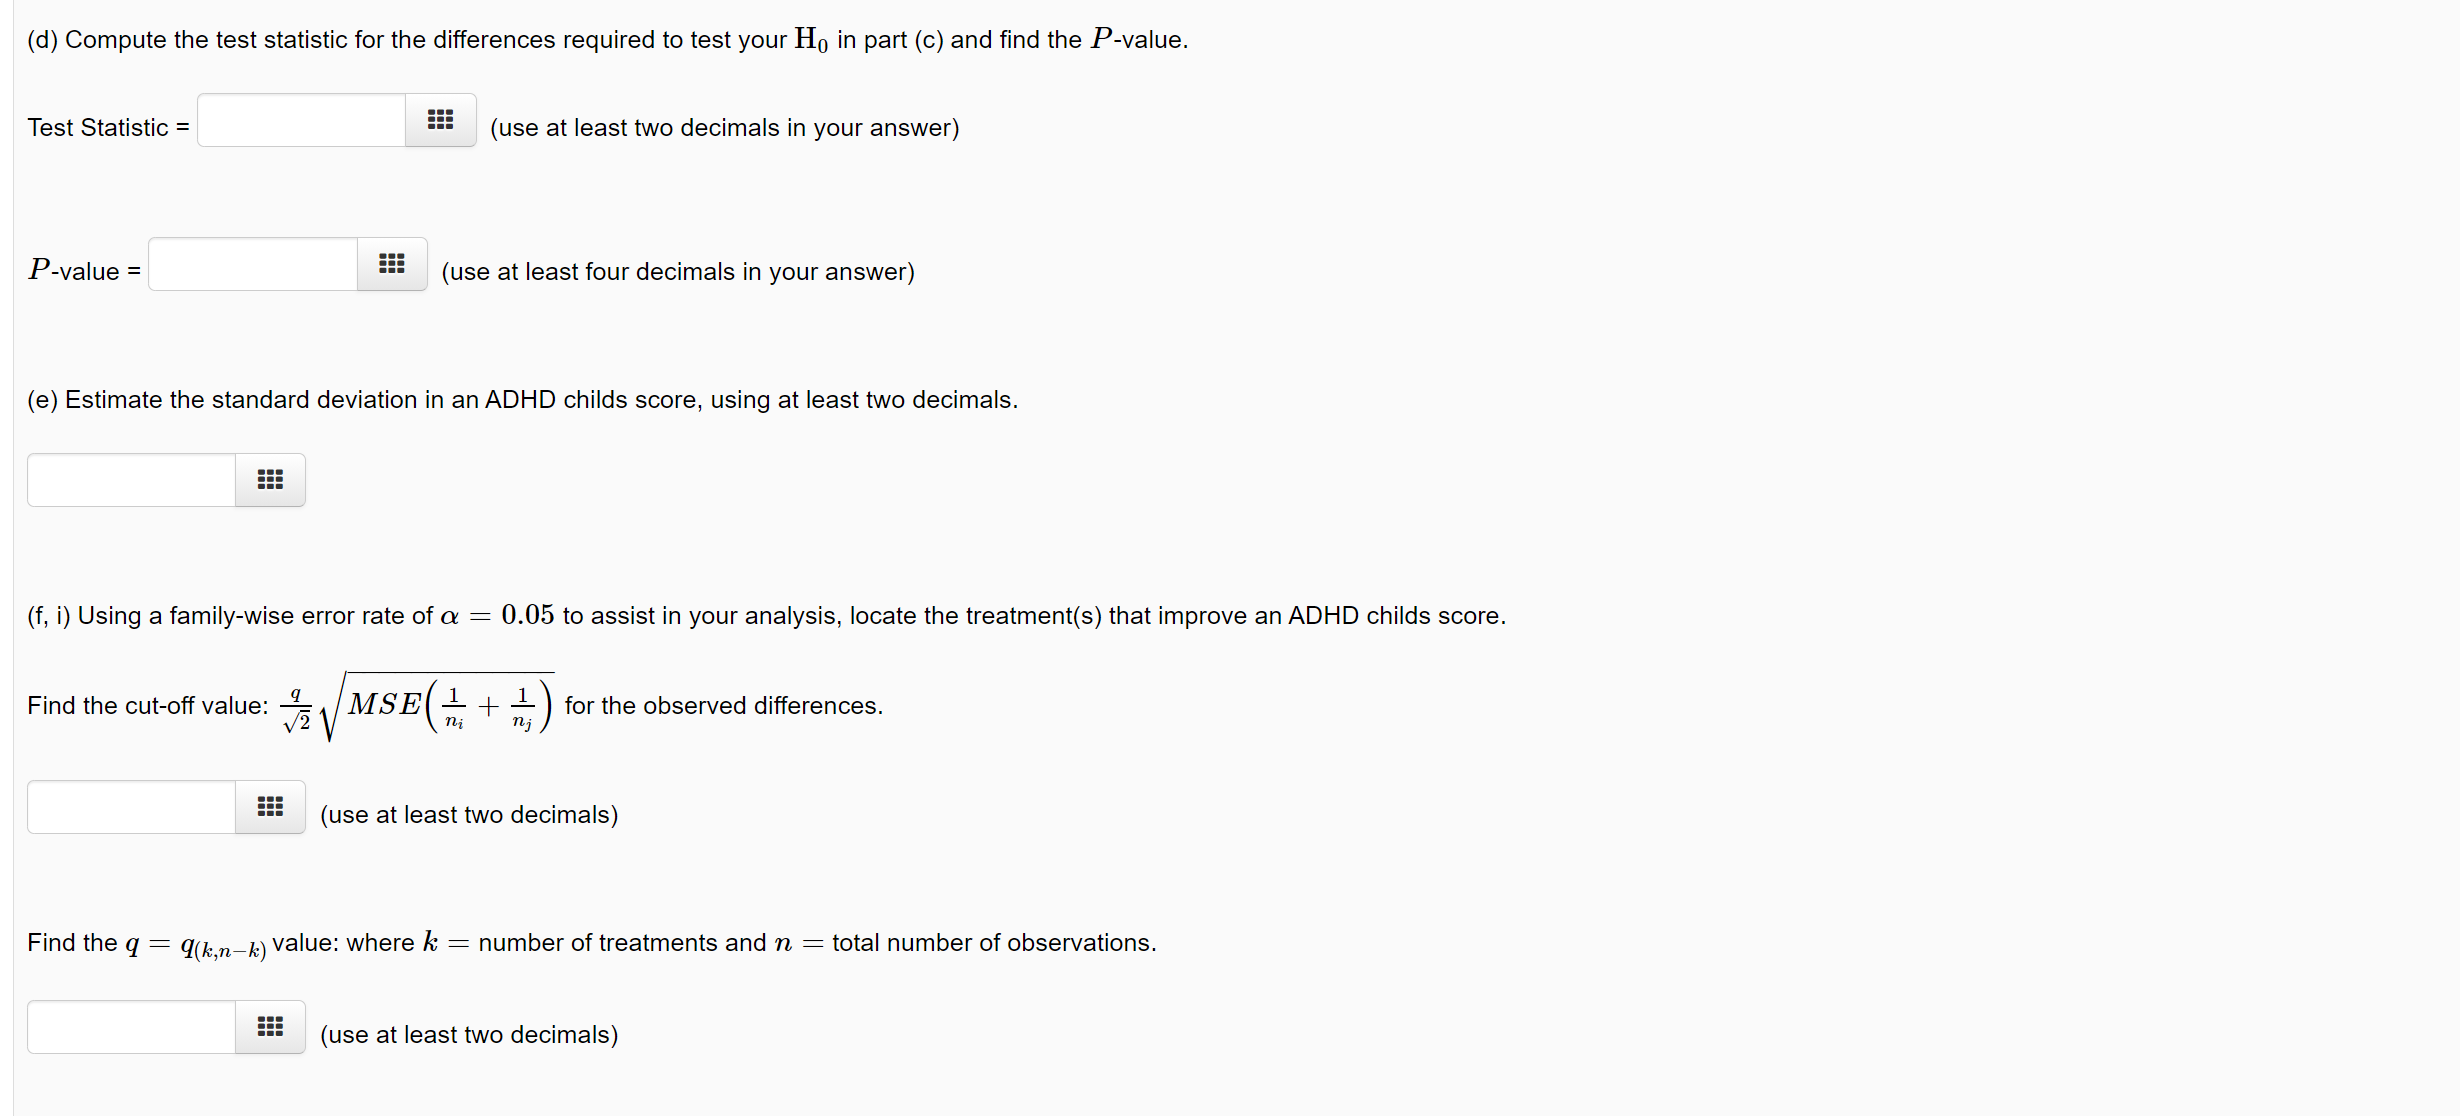
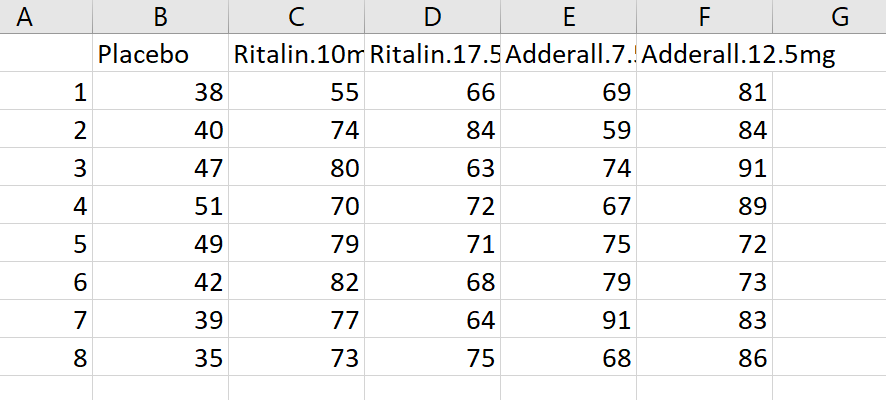
(d) Compute the test statistic for the differences required to test your H0 in part (c) and nd the P-value. Test Statistic = (use at least two decimals in your answer) P-value = === (use at least four decimals in your answer) (e) Estimate the standard deviation in an ADHD childs score, using at least two decimals. (f, i) Using a familywise error rate of a = 0.05 to assist in your analysis, locate the treatment(s) that improve an ADHD childs score. Find the cut-off value: i MSE( for the observed differences. (use at least two decimals) Find the q = chyn-kl value: where k = number of treatments and n = total number of observations. (use at least two decimals) (fii) Use Software to perform a Tukey HSD, Post Hoc analysis. Use a 95% confidence level and give at least 4 digits in all answers. When looking at the difference: Placebo-Adderall 12.5mg the lower limit for the difference is and the upper limit is . Based on the data the rst treatment listed is ? V then the second treatment listed. . Based on the data the rst treatment listed is When looking at the difference: Ritalin 10mgAdderall 7.5mg the lower limit for the difference is and the upper limit is '? V then the second treatment listed. (ii) Based only on the correct ANOVA and Post Has analysis of the above data, does the treatment influence the outcome? 7 A B C D E F G Placebo Ritalin.10m Ritalin.17.5 Adderall.7. Adderall.12.5mg 38 55 66 69 81 2 40 74 84 59 84 47 80 63 74 91 4 51 70 72 67 89 49 79 71 75 72 42 82 68 79 73 39 77 64 91 83 35 73 75 68 86(1 point) Willam E. Pelham et al. studied the how different levels of Ritalin and Adderall had on a child's ability to follow rules when the child is diagnosed with attention deficit hyperactivity disorder, or ADHD. The study involved the random assignment of children to one of five treatment groups: placebo, 10 mg Ritalin, 17.5 mg of Ritalin, 7.5 mg ofAdderall, or 12.5 mg ofAdderaII. Each child was to take their treatment twice a day. The response variable was a score which measured the child's ability to follow rules. The higher the score, the better the ability the child has to follow the rules. The data can be found in the Download .csv fi|-. Use or = 0.05 for any statistical tests. You will have to stack the data, try using the R command stack(data[2:6])...if you named the data file, data


