Answered step by step
Verified Expert Solution
Link Copied!

Question

1 Approved Answer

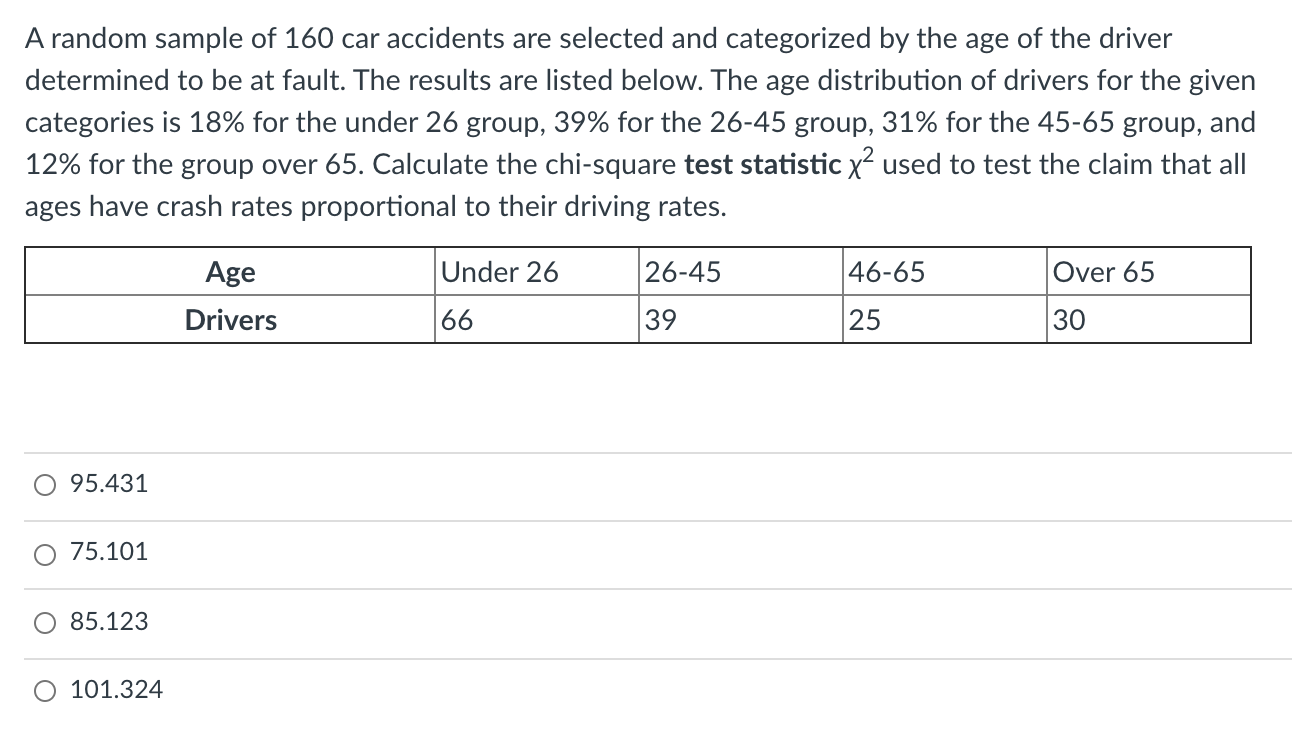
Please answer this question A random sample of 160 car accidents are selected and categorized by the age of the driver determined to be at

Please answer this question

image text in transcribed
A random sample of 160 car accidents are selected and categorized by the age of the driver determined to be at fault. The results are listed below. The age distribution of drivers for the given categories is 18% for the under 26 group, 39% for the 26-45 group, 31% for the 45-65 group, and 12% for the group over 65. Calculate the chi-square test statistic x2 used to test the claim that all ages have crash rates proportional to their driving rates. _ 0 95.431 0 75.101 0 85.123 0 101.324

Step by Step Solution

There are 3 Steps involved in it

Step: 1

blur-text-image

Get Instant Access to Expert-Tailored Solutions

See step-by-step solutions with expert insights and AI powered tools for academic success

Step: 2

blur-text-image

Step: 3

blur-text-image

Ace Your Homework with AI

Get the answers you need in no time with our AI-driven, step-by-step assistance

Get Started

Recommended Textbook for

Elementary Algebra

Authors: Charles P McKeague

2nd Edition

1483263819, 9781483263816

More Books

Students also viewed these Mathematics questions