

Answered step by step
Verified Expert Solution
Question
1 Approved Answer
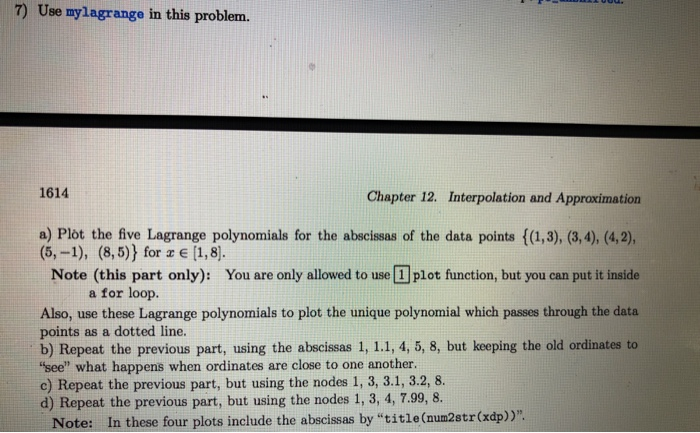
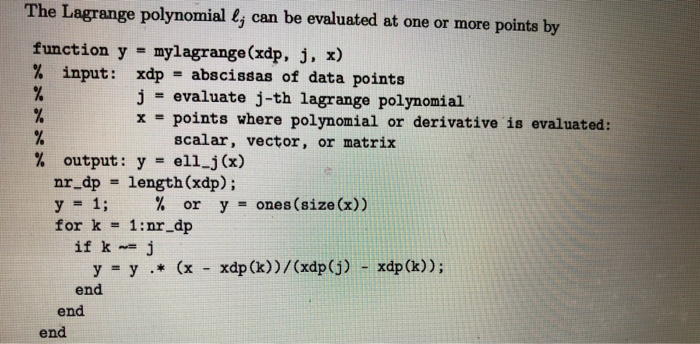
Please answer this question using Matlab. Thank you! 7) Use mylagrange in this problem. 1614 Chapter 12. Interpolation and Approximation a) Plot the five Lagrange
Please answer this question using Matlab. Thank you!
Step by Step Solution
There are 3 Steps involved in it
Step: 1

Get Instant Access to Expert-Tailored Solutions
See step-by-step solutions with expert insights and AI powered tools for academic success
Step: 2

Step: 3
Ace Your Homework with AI
Get the answers you need in no time with our AI-driven, step-by-step assistance
Get Started
Modern Database Management
Authors: Jeff Hoffer, Ramesh Venkataraman, Heikki Topi
12th edition
133544613, 978-0133544619