Please answer this questions.
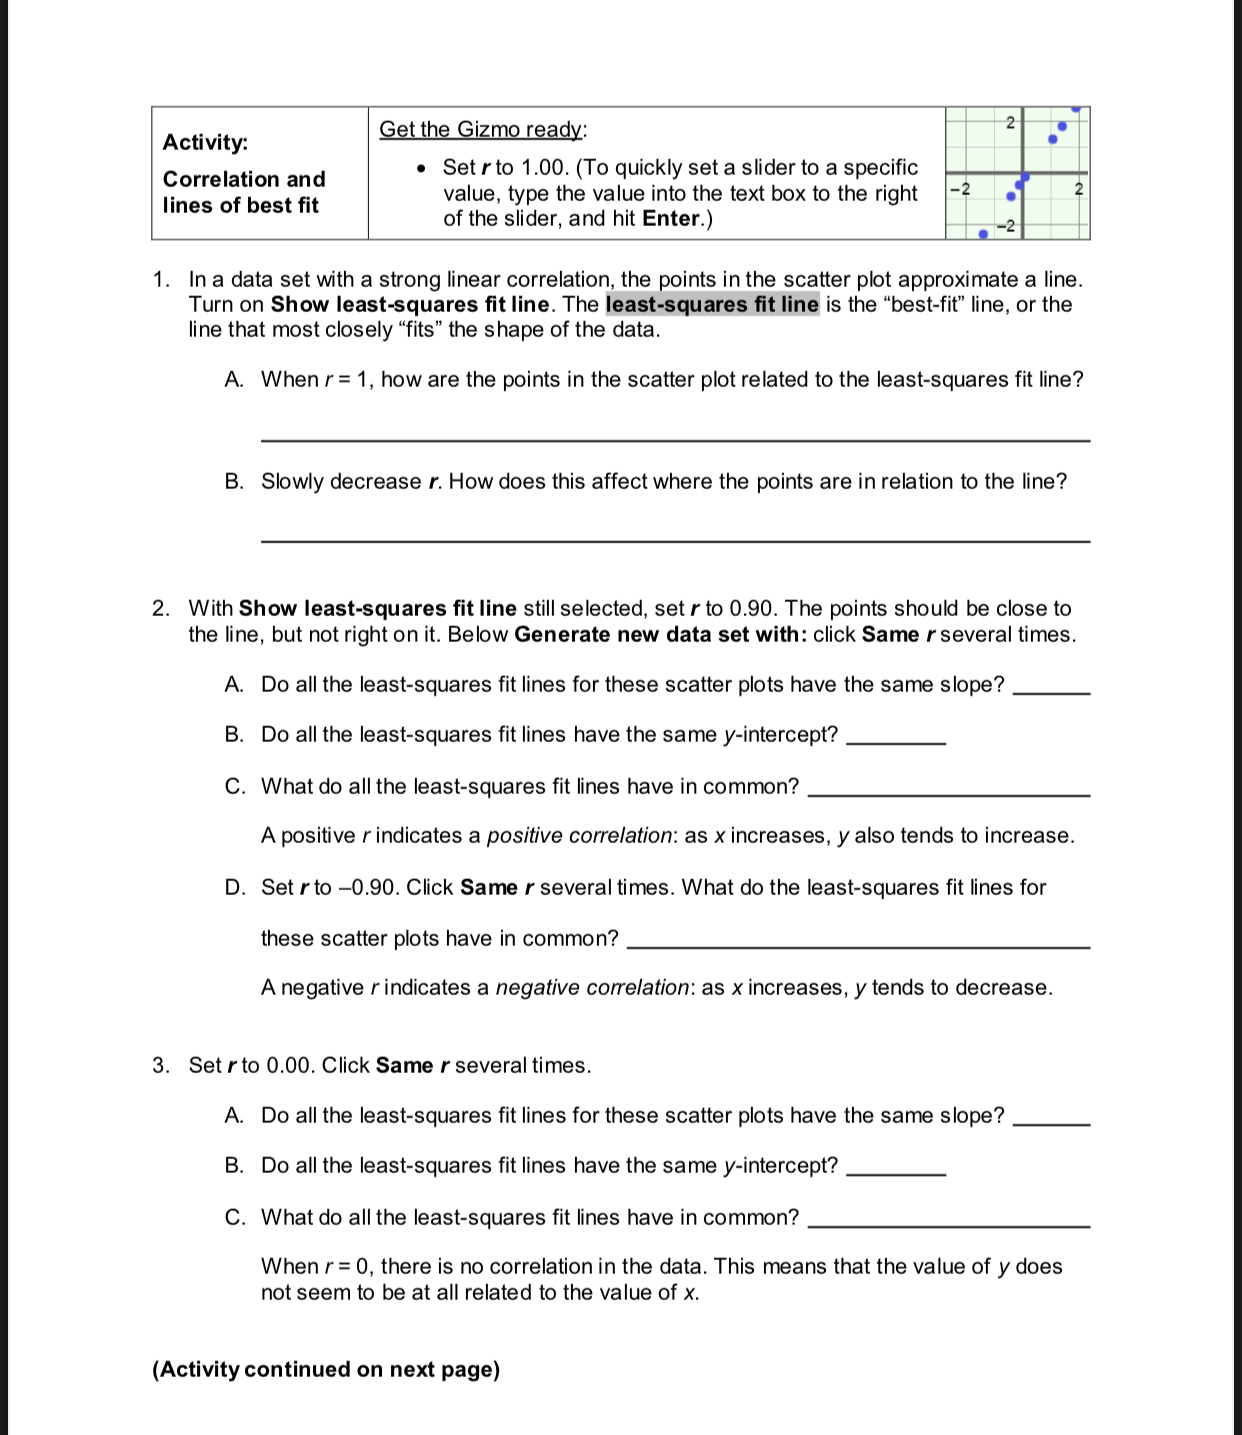
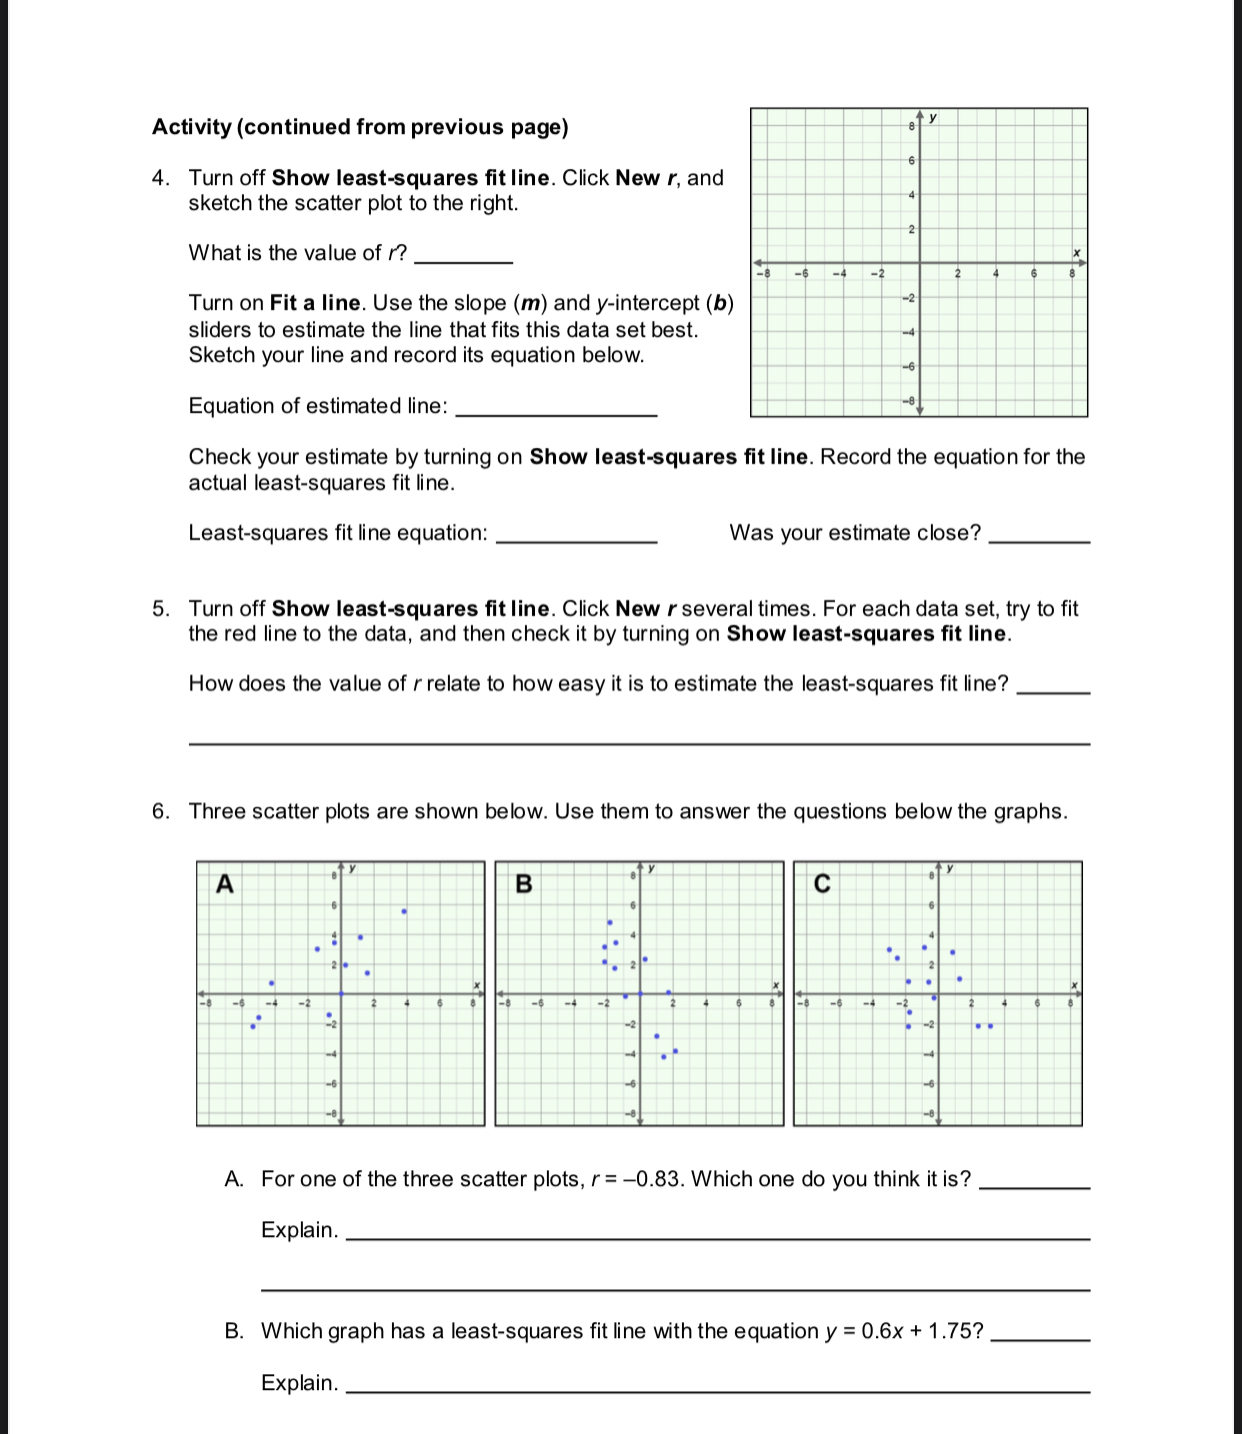
Activity: Get the Gizmo ready: 2 Correlation and . Set r to 1.00. (To quickly set a slider to a specific value, type the value into the text box to the right -2 lines of best fit of the slider, and hit Enter.) 1. In a data set with a strong linear correlation, the points in the scatter plot approximate a line. Turn on Show least-squares fit line. The least-squares fit line is the "best-fit" line, or the line that most closely "fits" the shape of the data. A. When r= 1, how are the points in the scatter plot related to the least-squares fit line? B. Slowly decrease r. How does this affect where the points are in relation to the line? 2. With Show least-squares fit line still selected, set r to 0.90. The points should be close to the line, but not right on it. Below Generate new data set with: click Same / several times. A. Do all the least-squares fit lines for these scatter plots have the same slope? B. Do all the least-squares fit lines have the same y-intercept? C. What do all the least-squares fit lines have in common? A positive r indicates a positive correlation: as x increases, y also tends to increase. D. Set r to -0.90. Click Same r several times. What do the least-squares fit lines for these scatter plots have in common? A negative r indicates a negative correlation: as x increases, y tends to decrease. 3. Set r to 0.00. Click Same r several times. A. Do all the least-squares fit lines for these scatter plots have the same slope? B. Do all the least-squares fit lines have the same y-intercept? C. What do all the least-squares fit lines have in common? When r = 0, there is no correlation in the data. This means that the value of y does not seem to be at all related to the value of x. (Activity continued on next page)Activity (continued from previous page) 4. Turn off Show least-squares t line. Click Now r. and sketch the scatter plot to the right. What is the value of r? Turn on Flt a line. Use the slope (m) and yintercept (b) sliders to estimate the line that fits this data set best. Sketch your line and record its equation below. Equation of estimated line: Check your estimate by turning on Show least-squares fit line. Record the equation for the actual least-squares fit Ii ne. Least-squares fit Ii ne equation: Was your estimate close? 5. Turn off Show least-squares t line. Click New rseveral times. For each data set, try to fit the red line to the data. and then check it by turning on Show least-squares t line. How does the value of r relate to how easy it is to estimate the least-squares fit line? 6. Three scatter plots are shown below. Use them to answer the questions below the graphs. A. For one of the three scatter plots, r = 0.83. Which one do you think it is? Explain. B. Which graph has a least-squares fit line with the equation y = 0.6x + 1.75? Explain


