Answered step by step
Verified Expert Solution
Question
1 Approved Answer
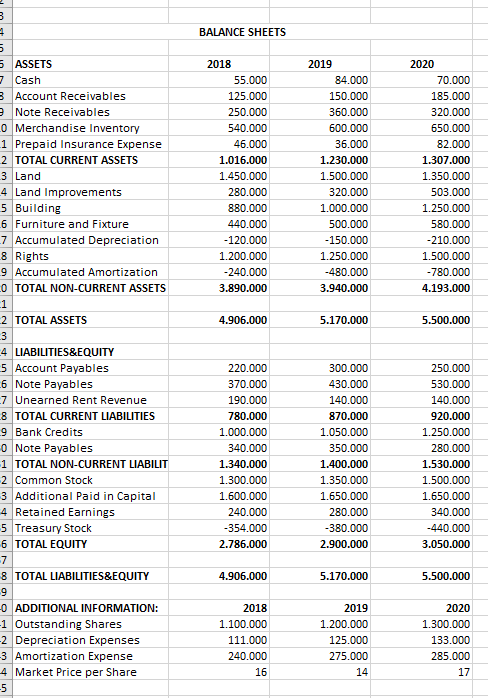
please answer this questions .thanks 3 st BALANCE SHEETS UT 2018 55.000 125.000 250.000 540.000 46.000 1.016.000 1.450.000 280.000 880.000 440.000 - 120.000 1.200.000 -240.000


please answer this questions .thanks
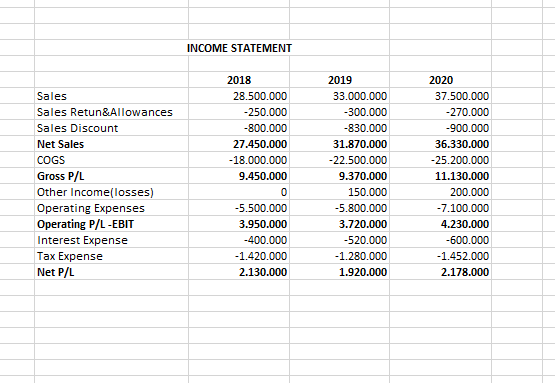
3 st BALANCE SHEETS UT 2018 55.000 125.000 250.000 540.000 46.000 1.016.000 1.450.000 280.000 880.000 440.000 - 120.000 1.200.000 -240.000 3.890.000 2019 84.000 150.000 360.000 600.000 36.000 1.230.000 1.500.000 320.000 1.000.000 500.000 - 150.000 1.250.000 -480.000 3.940.000 2020 70.000 185.000 320.000 650.000 82.000 1.307.000 1.350.000 503.000 1.250.000 580.000 -210.000 1.500.000 -780.000 4.193.000 4.906.000 5.170.000 5.500.000 5 ASSETS 7 Cash 3 Account Receivables e Note Receivables LO Merchandise Inventory 1 Prepaid Insurance Expense 2 TOTAL CURRENT ASSETS 3 Land 4 Land Improvements 5 Building 6 Furniture and Fixture 7 Accumulated Depreciation 8 Rights 9 Accumulated Amortization 0 TOTAL NON-CURRENT ASSETS 1 2 TOTAL ASSETS 3 -4 LIABILITIES&EQUITY 5 Account Payables -6 Note Payables -7 Unearned Rent Revenue 8 TOTAL CURRENT LIABILITIES 9 Bank Credits 0 Note Payables 1 TOTAL NON-CURRENT LIABILIT 2 Common Stock 3 Additional Paid in Capital 4 Retained Earnings 5 Treasury Stock 6 TOTAL EQUITY -7 8 TOTAL LIABILITIES&EQUITY 9 O ADDITIONAL INFORMATION: -1 Outstanding Shares -2 Depreciation Expenses -3 Amortization Expense 4 Market Price per Share -5 220.000 370.000 190.000 780.000 1.000.000 340.000 1.340.000 1.300.000 1.600.000 240.000 -354.000 2.786.000 300.000 430.000 140.000 870.000 1.050.000 350.000 1.400.000 1.350.000 1.650.000 280.000 -380.000 2.900.000 250.000 530.000 140.000 920.000 1.250.000 280.000 1.530.000 1.500.000 1.650.000 340.000 -440.000 3.050.000 4.906.000 5.170.000 5.500.000 2018 1.100.000 111.000 240.000 16 2019 1.200.000 125.000 275.000 14 2020 1.300.000 133.000 285.000 17 INCOME STATEMENT Sales Sales Retun&Allowances Sales Discount Net Sales COGS Gross P/L Other Incomellosses) Operating Expenses Operating P/L-EBIT Interest Expense Tax Expense Net P/L 2018 28.500.000 -250.000 -800.000 27.450.000 -18.000.000 9.450.000 0 -5.500.000 3.950.000 -400.000 -1.420.000 2.130.000 2019 33.000.000 -300.000 -830.000 31.870.000 -22.500.000 9.370.000 150.000 -5.800.000 3.720.000 -520.000 -1.280.000 1.920.000 2020 37.500.000 -270.000 -900.000 36.330.000 -25.200.000 11.130.000 200.000 -7.100.000 4.230.000 -600.000 -1.452.000 2.178.000 47 Reuired: 48 You are required to assess; a)overall financial standing of the company b) whether this company is eligible for credit c) whether this company is a good investment alternative 49 You are expected to employ the following financial statement analysis techniques below at minimum. You can incorporate more analysis techniques to form your opinion. 50Step by Step Solution
There are 3 Steps involved in it
Step: 1

Get Instant Access to Expert-Tailored Solutions
See step-by-step solutions with expert insights and AI powered tools for academic success
Step: 2

Step: 3

Ace Your Homework with AI
Get the answers you need in no time with our AI-driven, step-by-step assistance
Get Started


