Answered step by step
Verified Expert Solution
Question
1 Approved Answer
Please answer thoroughly and answer all components of the questions. Thank you! What you perceive as strengths and weaknesses of the company Any areas that

Please answer thoroughly and answer all components of the questions. Thank you!
What you perceive as strengths and weaknesses of the company
Any areas that might warrant additional explanation or analysis
Any potential follow-up questions you would have for the company
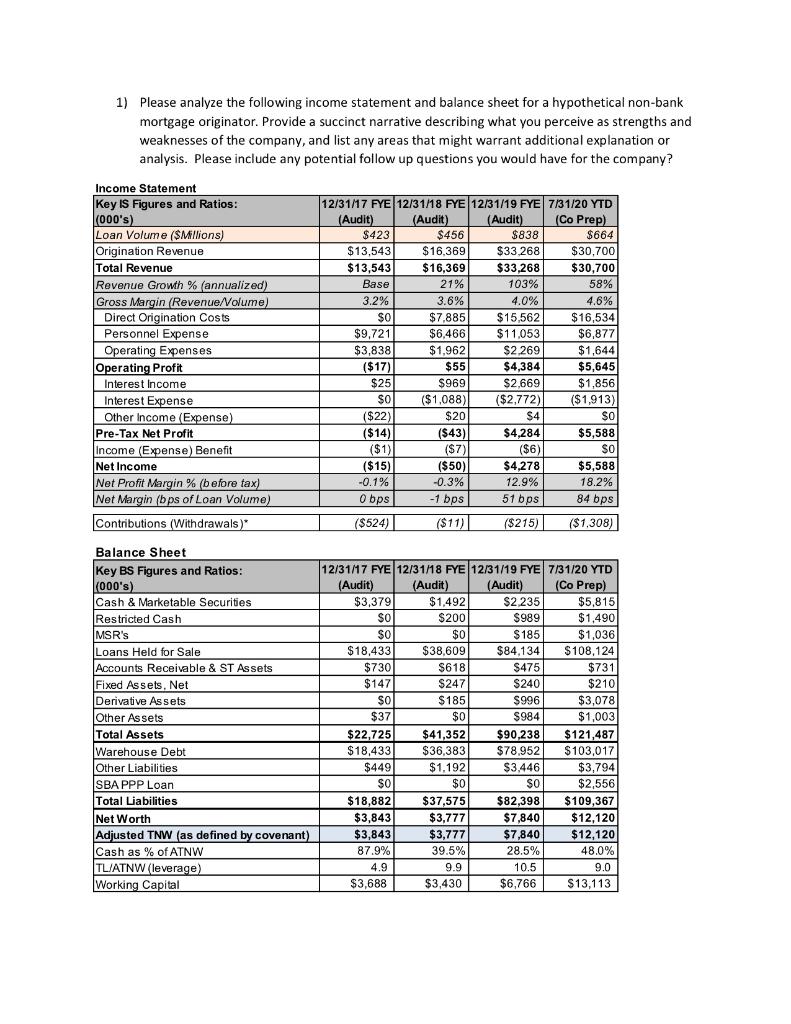
1) Please analyze the following income statement and balance sheet for a hypothetical non-bank mortgage originator. Provide a succinct narrative describing what you perceive as strengths and weaknesses of the company, and list any areas that might warrant additional explanation or analysis. Please include any potential follow up questions you would have for the company? Income Statement Key Is Figures and Ratios: (000's) Loan Volume ($Millions) Origination Revenue Total Revenue Revenue Growth % (annualized) Gross Margin (Revenue/Volume) Direct Origination Costs Personnel Expense Operating Expenses Operating Profit Interest Income Interest Expense Other Income (Expense) Pre-Tax Net Profit Income (Expense) Benefit Net Income Net Profit Margin % (before tax) Net Margin (bps of Loan Volume) Contributions (Withdrawals) 12/31/17 FYE 12/31/18 FYE 12/31/19 FYE 7/31/20 YTD (Audit) (Audit) (Audit) (Co Prep) $423 $456 $838 $664 $13,543 $16.369 $33268 $30,700 $13,543 $16,369 $33,268 $30,700 Base 21% 103% 58% 3.2% 3.6% 4.0% 9.00 4.6% $0 $7,885 $15,562 $16,534 $9,721 $6,466 $11,053 $6,877 $3,838 $1,962 $2 269 $1,644 ($17) $55 $4,384 $5,645 $25 $969 $2.669 $1,856 $0 $ ($1,088) ($2.772) ($1,913) ($22) $20 $4 SO ($14) (543) $4,284 $5,588 ($1) ($7) ($6) SO ($15) ($50) $4,278 $5,588 -0.1% -0.3% 12.9% 18.2% Obps -1 bps 51 bps 84 bps ($524) ($11) ($215) ($1,308) Balance Sheet Key BS Figures and Ratios: (000's) Cash & Marketable Securities Restricted Cash MSR's Loans Held for Sale Accounts Receivable & ST Assets Fixed Assets, Net Derivative Assets Other Assets $18.433 Total Assets 12/31/17 FYE 12/31/18 FYE 12/31/19 FYE 7/31/20 YTD (Audit) (Audit) (Audit) (Co Prep) $3,379 $1,492 $2.235 $5,815 SO $200 $989 $1,490 SO $0 $185 $1,036 1.036 $38.609 $84.134 $108,124 0.12 $730 $618 $475 $731 9731 $147 $247 $240 $210 $0 $185 $996 $3,078 $37 $0 $984 $1,003 $22,725 $41,352 $90,238 $18,433 $36,383 $78,952 $449 $1,192 $3.446 $3,794 $0 $0 $0 $2.556 $18,882 $37,575 $82.398 $109,367 $3,843 $3,777 $7,840 $12,120 $3,843 $3,777 $7,840 $12,120 87.9% 39.5% 28.5% 48.0% 4.9 9.9 9.0 $3,688 $3,430 $6,766 $13,113 $121,487 $ 103,017 Warehouse Debt Other Liabilities SBA PPP Loan Total Liabilities Net Worth Adjusted TNW (as defined by covenant) Cash as % of ATNW TL/ATNW (leverage) Working Capital 10.5 1) Please analyze the following income statement and balance sheet for a hypothetical non-bank mortgage originator. Provide a succinct narrative describing what you perceive as strengths and weaknesses of the company, and list any areas that might warrant additional explanation or analysis. Please include any potential follow up questions you would have for the company? Income Statement Key Is Figures and Ratios: (000's) Loan Volume ($Millions) Origination Revenue Total Revenue Revenue Growth % (annualized) Gross Margin (Revenue/Volume) Direct Origination Costs Personnel Expense Operating Expenses Operating Profit Interest Income Interest Expense Other Income (Expense) Pre-Tax Net Profit Income (Expense) Benefit Net Income Net Profit Margin % (before tax) Net Margin (bps of Loan Volume) Contributions (Withdrawals) 12/31/17 FYE 12/31/18 FYE 12/31/19 FYE 7/31/20 YTD (Audit) (Audit) (Audit) (Co Prep) $423 $456 $838 $664 $13,543 $16.369 $33268 $30,700 $13,543 $16,369 $33,268 $30,700 Base 21% 103% 58% 3.2% 3.6% 4.0% 9.00 4.6% $0 $7,885 $15,562 $16,534 $9,721 $6,466 $11,053 $6,877 $3,838 $1,962 $2 269 $1,644 ($17) $55 $4,384 $5,645 $25 $969 $2.669 $1,856 $0 $ ($1,088) ($2.772) ($1,913) ($22) $20 $4 SO ($14) (543) $4,284 $5,588 ($1) ($7) ($6) SO ($15) ($50) $4,278 $5,588 -0.1% -0.3% 12.9% 18.2% Obps -1 bps 51 bps 84 bps ($524) ($11) ($215) ($1,308) Balance Sheet Key BS Figures and Ratios: (000's) Cash & Marketable Securities Restricted Cash MSR's Loans Held for Sale Accounts Receivable & ST Assets Fixed Assets, Net Derivative Assets Other Assets $18.433 Total Assets 12/31/17 FYE 12/31/18 FYE 12/31/19 FYE 7/31/20 YTD (Audit) (Audit) (Audit) (Co Prep) $3,379 $1,492 $2.235 $5,815 SO $200 $989 $1,490 SO $0 $185 $1,036 1.036 $38.609 $84.134 $108,124 0.12 $730 $618 $475 $731 9731 $147 $247 $240 $210 $0 $185 $996 $3,078 $37 $0 $984 $1,003 $22,725 $41,352 $90,238 $18,433 $36,383 $78,952 $449 $1,192 $3.446 $3,794 $0 $0 $0 $2.556 $18,882 $37,575 $82.398 $109,367 $3,843 $3,777 $7,840 $12,120 $3,843 $3,777 $7,840 $12,120 87.9% 39.5% 28.5% 48.0% 4.9 9.9 9.0 $3,688 $3,430 $6,766 $13,113 $121,487 $ 103,017 Warehouse Debt Other Liabilities SBA PPP Loan Total Liabilities Net Worth Adjusted TNW (as defined by covenant) Cash as % of ATNW TL/ATNW (leverage) Working Capital 10.5
Step by Step Solution
There are 3 Steps involved in it
Step: 1

Get Instant Access to Expert-Tailored Solutions
See step-by-step solutions with expert insights and AI powered tools for academic success
Step: 2

Step: 3

Ace Your Homework with AI
Get the answers you need in no time with our AI-driven, step-by-step assistance
Get Started


