Please answer to get many likes!!!
Round 2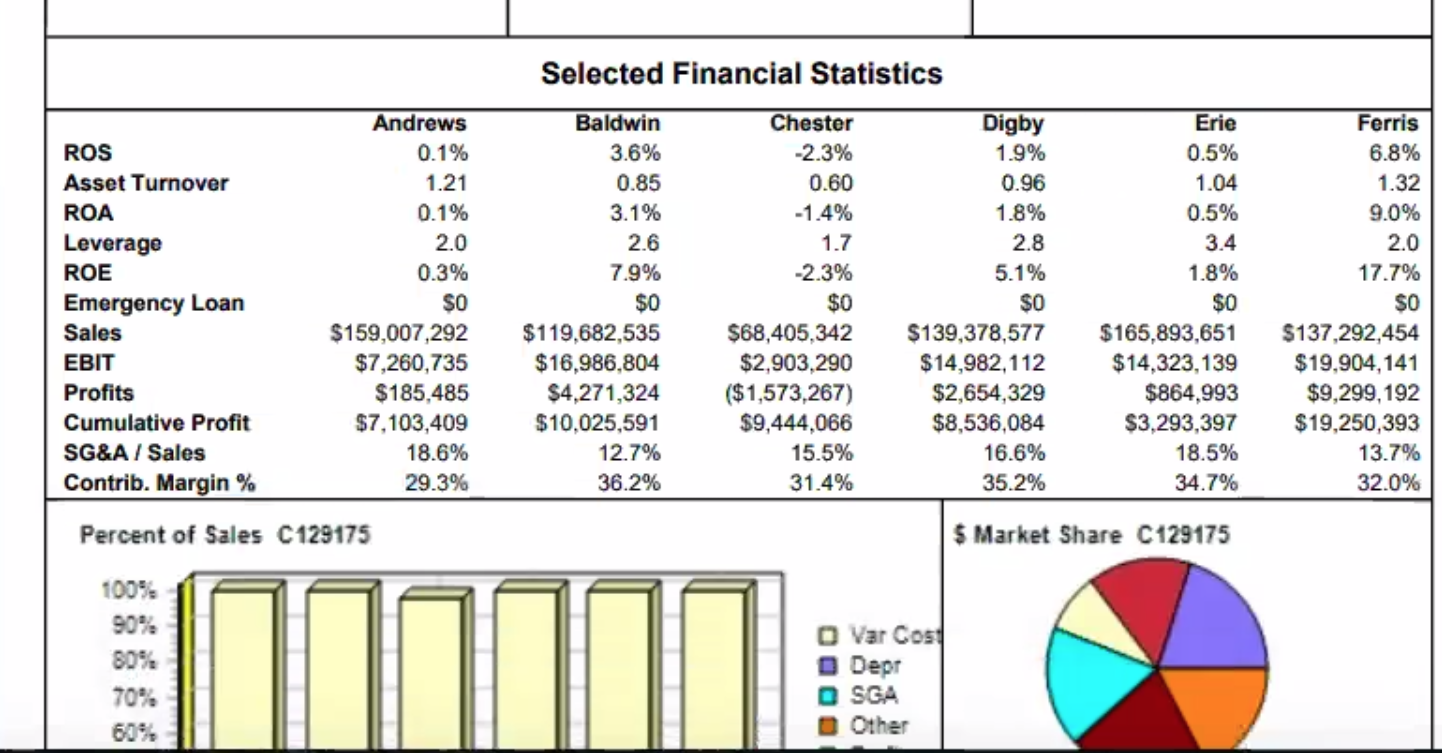
Round 3
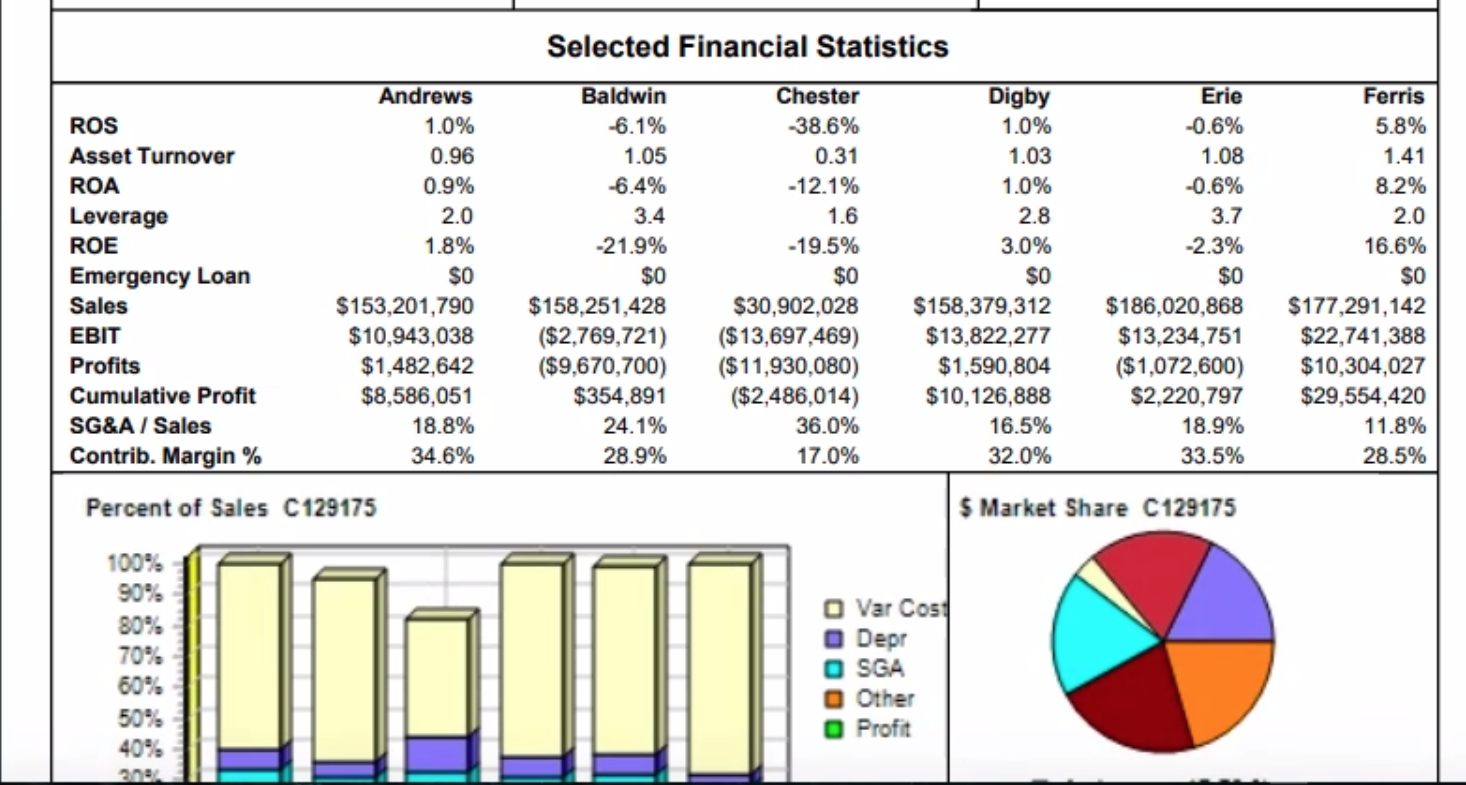
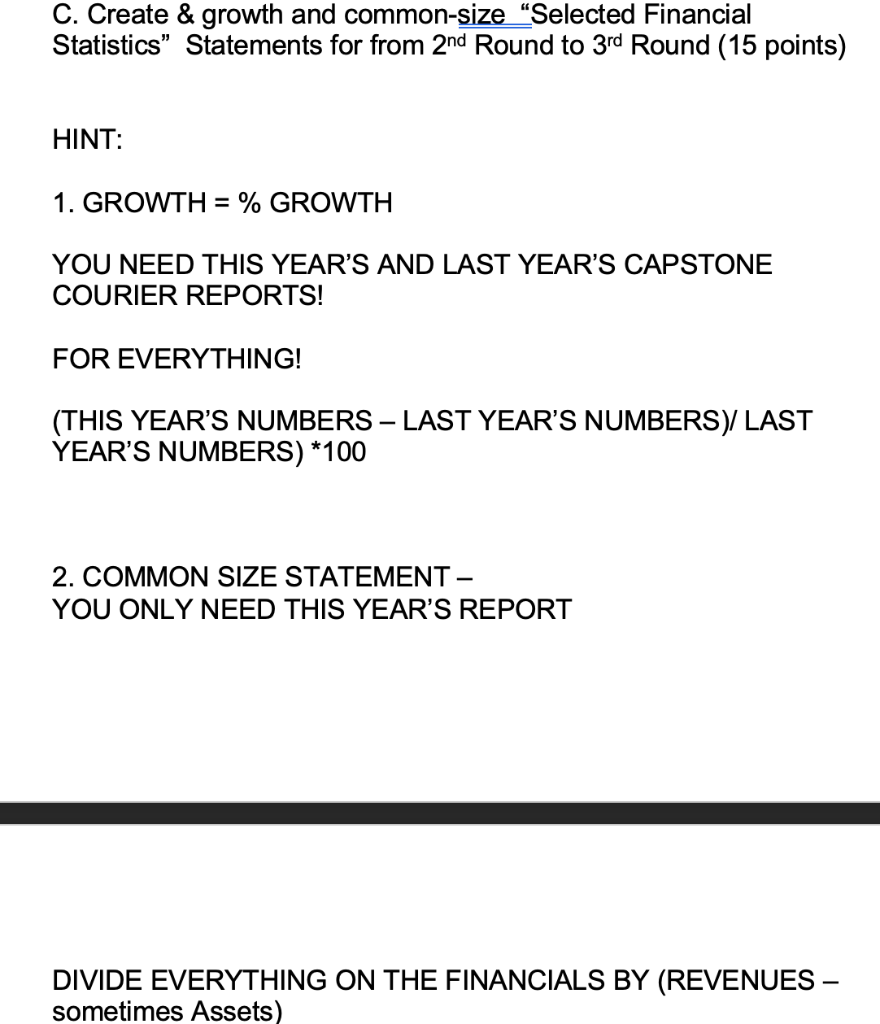
C. Create & growth and common-size_Selected Financial Statistics Statements for from 2nd Round to 3rd Round (15 points) HINT: 1. GROWTH = % GROWTH YOU NEED THIS YEAR'S AND LAST YEAR'S CAPSTONE COURIER REPORTS! FOR EVERYTHING! (THIS YEAR'S NUMBERS LAST YEAR'S NUMBERS)/ LAST YEAR'S NUMBERS) *100 2. COMMON SIZE STATEMENT YOU ONLY NEED THIS YEAR'S REPORT DIVIDE EVERYTHING ON THE FINANCIALS BY (REVENUES sometimes Assets) Selected Financial Statistics Andrews ROS 0.1% Asset Turnover 1.21 ROA 0.1% Leverage 2.0 ROE 0.3% Emergency Loan $0 Sales $159,007,292 EBIT $7,260,735 Profits $185,485 Cumulative Profit $7,103,409 SG&A / Sales 18.6% Contrib. Margin% 29.3% Percent of Sales C129175 Baldwin 3.6% 0.85 3.1% 2.6 7.9% $0 $119,682,535 $16,986,804 $4,271,324 $10.025,591 12.7% 36.2% Chester -2.3% 0.60 -1.4% 1.7 -2.3% $0 $68,405,342 $2,903,290 ($1,573,267) $9,444,066 15.5% 31.4% Digby 1.9% 0.96 1.8% 2.8 5.1% SO $139,378,577 $14,982,112 $2,654,329 $8,536,084 16.6% 35.2% Erie 0.5% 1.04 0.5% 3.4 1.8% $0 $165,893,651 $14,323,139 $864,993 $3,293,397 18.5% 34.7% Ferris 6.8% 1.32 9.0% 2.0 17.7% $0 $137,292,454 $19,904, 141 $9,299,192 $19,250,393 13.7% 32.0% $ Market Share C129175 100% 90% 80% 70% 60%. Var Cost Depr O SGA 1 Other Selected Financial Statistics Andrews 1.0% 0.96 0.9% 2.0 ROS Asset Turnover ROA Leverage ROE Emergency Loan Sales EBIT Profits Cumulative Profit SG&A / Sales Contrib. Margin % 1.8% $0 $153,201,790 $10,943,038 $1,482,642 $8,586,051 18.8% 34.6% Baldwin -6.1% 1.05 -6.4% 3.4 -21.9% $0 $158,251,428 ($2,769,721) ($9,670,700) $354,891 24.1% 28.9% Chester 38.6% 0.31 -12.1% 1.6 -19.5% $0 $30,902,028 ($13,697,469) ($11,930,080) ($2,486,014) 36.0% 17.0% Digby 1.0% 1.03 1.0% 2.8 3.0% $0 $158,379,312 $13,822,277 $1,590,804 $10,126,888 16.5% 32.0% Erie -0.6% 1.08 -0.6% 3.7 -2.3% $0 $186,020,868 $13,234,751 ($1,072,600) $2,220,797 18.9% 33.5% Ferris 5.8% 1.41 8.2% 2.0 16.6% $0 $177,291, 142 $22,741,388 $10,304,027 $29,554,420 11.8% 28.5% Percent of Sales C129175 S Market Share C129175 100% 90% 80% 70%. 60% 50% 40% 200 Var Cost Depr SGA 0 Other O Profit C. Create & growth and common-size_Selected Financial Statistics Statements for from 2nd Round to 3rd Round (15 points) HINT: 1. GROWTH = % GROWTH YOU NEED THIS YEAR'S AND LAST YEAR'S CAPSTONE COURIER REPORTS! FOR EVERYTHING! (THIS YEAR'S NUMBERS LAST YEAR'S NUMBERS)/ LAST YEAR'S NUMBERS) *100 2. COMMON SIZE STATEMENT YOU ONLY NEED THIS YEAR'S REPORT DIVIDE EVERYTHING ON THE FINANCIALS BY (REVENUES sometimes Assets) Selected Financial Statistics Andrews ROS 0.1% Asset Turnover 1.21 ROA 0.1% Leverage 2.0 ROE 0.3% Emergency Loan $0 Sales $159,007,292 EBIT $7,260,735 Profits $185,485 Cumulative Profit $7,103,409 SG&A / Sales 18.6% Contrib. Margin% 29.3% Percent of Sales C129175 Baldwin 3.6% 0.85 3.1% 2.6 7.9% $0 $119,682,535 $16,986,804 $4,271,324 $10.025,591 12.7% 36.2% Chester -2.3% 0.60 -1.4% 1.7 -2.3% $0 $68,405,342 $2,903,290 ($1,573,267) $9,444,066 15.5% 31.4% Digby 1.9% 0.96 1.8% 2.8 5.1% SO $139,378,577 $14,982,112 $2,654,329 $8,536,084 16.6% 35.2% Erie 0.5% 1.04 0.5% 3.4 1.8% $0 $165,893,651 $14,323,139 $864,993 $3,293,397 18.5% 34.7% Ferris 6.8% 1.32 9.0% 2.0 17.7% $0 $137,292,454 $19,904, 141 $9,299,192 $19,250,393 13.7% 32.0% $ Market Share C129175 100% 90% 80% 70% 60%. Var Cost Depr O SGA 1 Other Selected Financial Statistics Andrews 1.0% 0.96 0.9% 2.0 ROS Asset Turnover ROA Leverage ROE Emergency Loan Sales EBIT Profits Cumulative Profit SG&A / Sales Contrib. Margin % 1.8% $0 $153,201,790 $10,943,038 $1,482,642 $8,586,051 18.8% 34.6% Baldwin -6.1% 1.05 -6.4% 3.4 -21.9% $0 $158,251,428 ($2,769,721) ($9,670,700) $354,891 24.1% 28.9% Chester 38.6% 0.31 -12.1% 1.6 -19.5% $0 $30,902,028 ($13,697,469) ($11,930,080) ($2,486,014) 36.0% 17.0% Digby 1.0% 1.03 1.0% 2.8 3.0% $0 $158,379,312 $13,822,277 $1,590,804 $10,126,888 16.5% 32.0% Erie -0.6% 1.08 -0.6% 3.7 -2.3% $0 $186,020,868 $13,234,751 ($1,072,600) $2,220,797 18.9% 33.5% Ferris 5.8% 1.41 8.2% 2.0 16.6% $0 $177,291, 142 $22,741,388 $10,304,027 $29,554,420 11.8% 28.5% Percent of Sales C129175 S Market Share C129175 100% 90% 80% 70%. 60% 50% 40% 200 Var Cost Depr SGA 0 Other O Profit