Answered step by step
Verified Expert Solution
Question
1 Approved Answer
PLEASE ANSWER USING BASIC BEGINNER C++ CODING PLEASE USE PROTOTYPES AND PUT FUNCTIONS UNDER MAIN DATA FILE: January 70 49 3.12 February 69 50 3.80
PLEASE ANSWER USING BASIC BEGINNER C++ CODING
PLEASE USE PROTOTYPES AND PUT FUNCTIONS UNDER MAIN
DATA FILE:
January 70 49 3.12 February 69 50 3.80 March 70 54 2.43 April 74 56 0.91 May 74 58 0.26 June 78 62 0.09 July 83 65 0.01 August 84 66 0.04 September 84 65 0.24 October 81 61 0.66 November 74 54 1.04 December 68 49 2.33
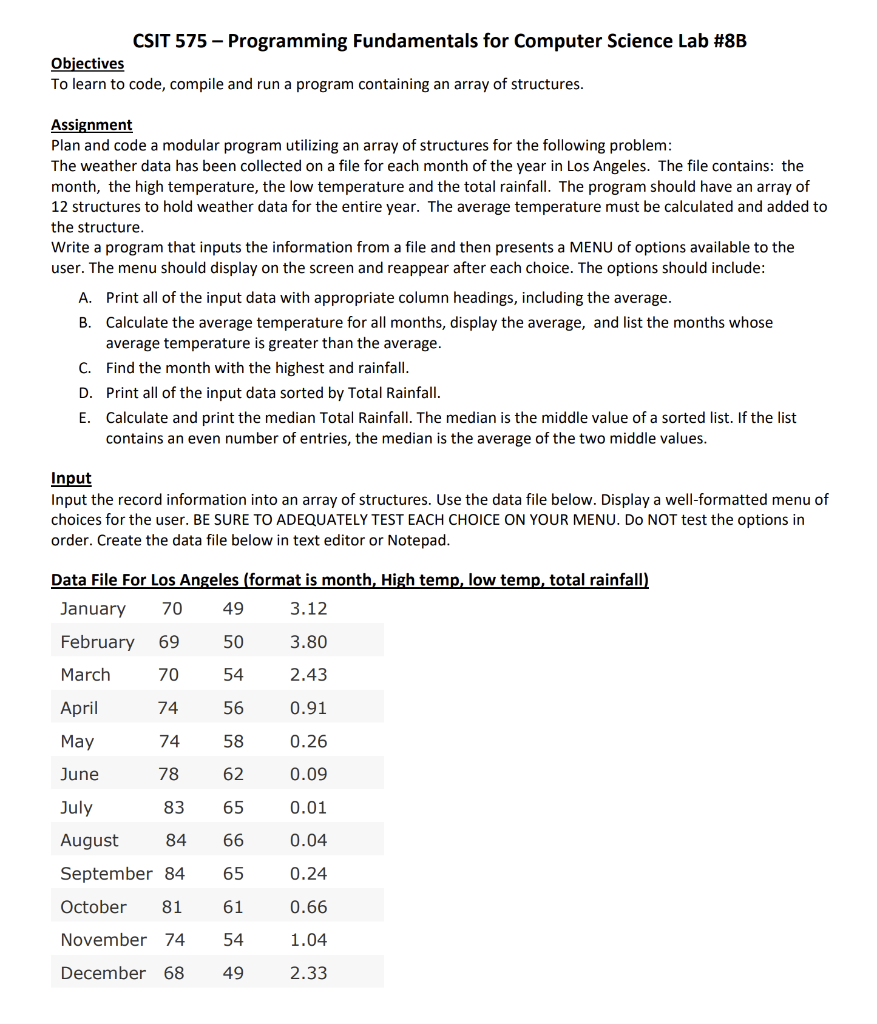
CSIT 575 - Programming Fundamentals for Computer Science Lab #8B Objectives To learn to code, compile and run a program containing an array of structures. Assignment Plan and code a modular program utilizing an array of structures for the following problem: The weather data has been collected on a file for each month of the year in Los Angeles. The file contains: the month, the high temperature, the low temperature and the total rainfall. The program should have an array of 12 structures to hold weather data for the entire year. The average temperature must be calculated and added to the structure. Write a program that inputs the information from a file and then presents a MENU of options available to the user. The menu should display on the screen and reappear after each choice. The options should include: A. Print all of the input data with appropriate column headings, including the average. B. Calculate the average temperature for all months, display the average, and list the months whose average temperature is greater than the average. C. Find the month with the highest and rainfall. D. Print all of the input data sorted by Total Rainfall. E. Calculate and print the median Total Rainfall. The median is the middle value of a sorted list. If the list contains an even number of entries, the median is the average of the two middle values. Input Input the record information into an array of structures. Use the data file below. Display a well-formatted menu of choices for the user. BE SURE TO ADEQUATELY TEST EACH CHOICE ON YOUR MENU. DO NOT test the options in order. Create the data file below in text editor or Notepad. Data File For Los Angeles (format is month, High temp, low temp, total rainfall) January 70 49 3.12 February 69 50 3.80 March 70 54 2.43 April 74 56 0.91 May 74 58 0.26 June 78 62 0.09 July 83 65 0.01 66 0.04 August 84 September 84 65 0.24 October 81 61 0.66 November 74 54 1.04 December 68 49 2.33
Step by Step Solution
There are 3 Steps involved in it
Step: 1
Get Instant Access to Expert-Tailored Solutions
See step-by-step solutions with expert insights and AI powered tools for academic success
Step: 2
Step: 3
Ace Your Homework with AI
Get the answers you need in no time with our AI-driven, step-by-step assistance
Get Started