Answered step by step
Verified Expert Solution
Question
1 Approved Answer
please answer using cell formulas. thank you so much! please answer all yellow boxes using cell formulas Webmasters.com has developed a powerful new server that
please answer using cell formulas. thank you so much! 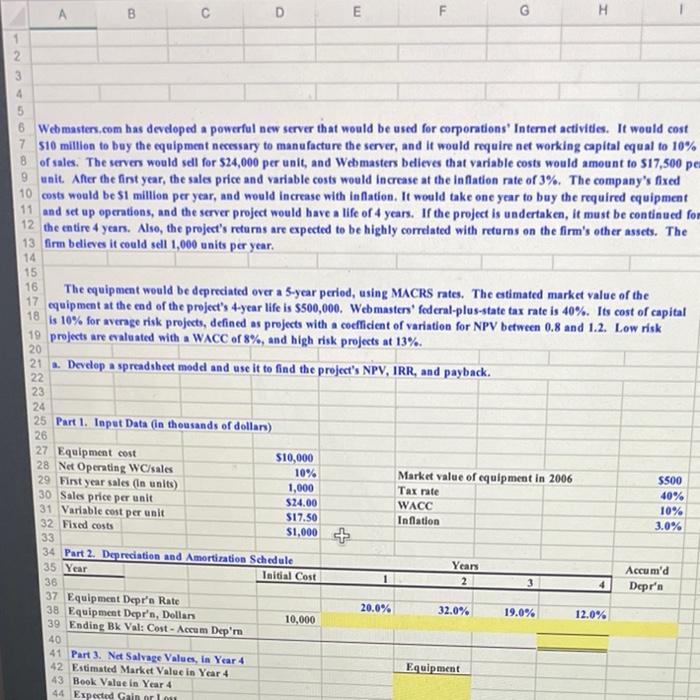
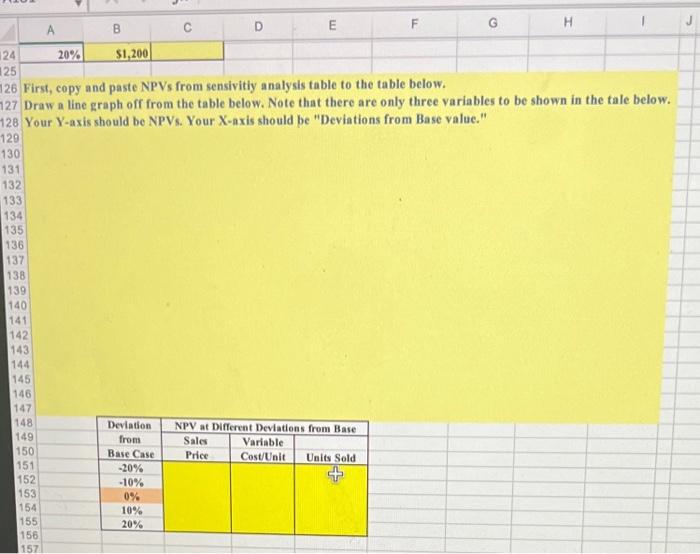
please answer all yellow boxes using cell formulas
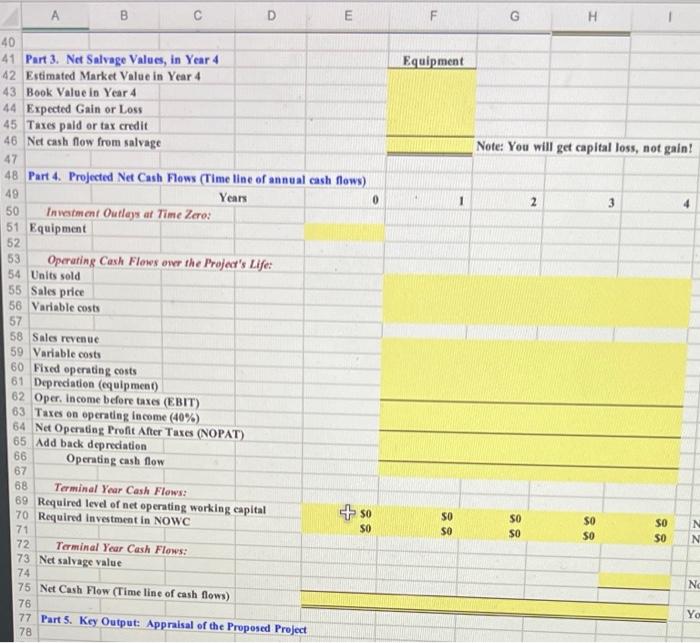
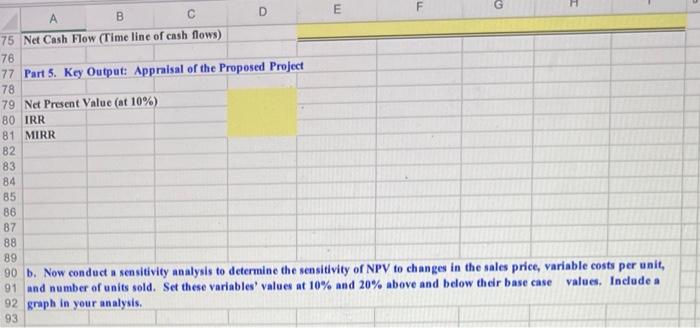
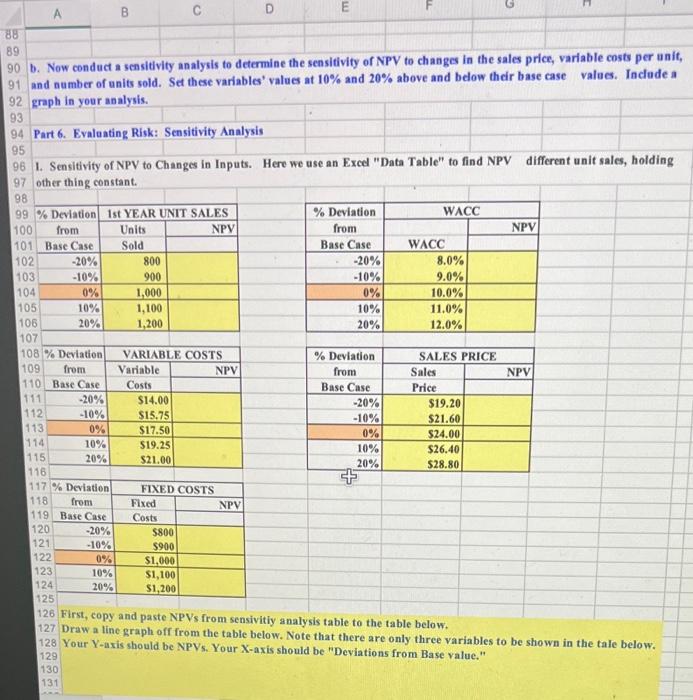
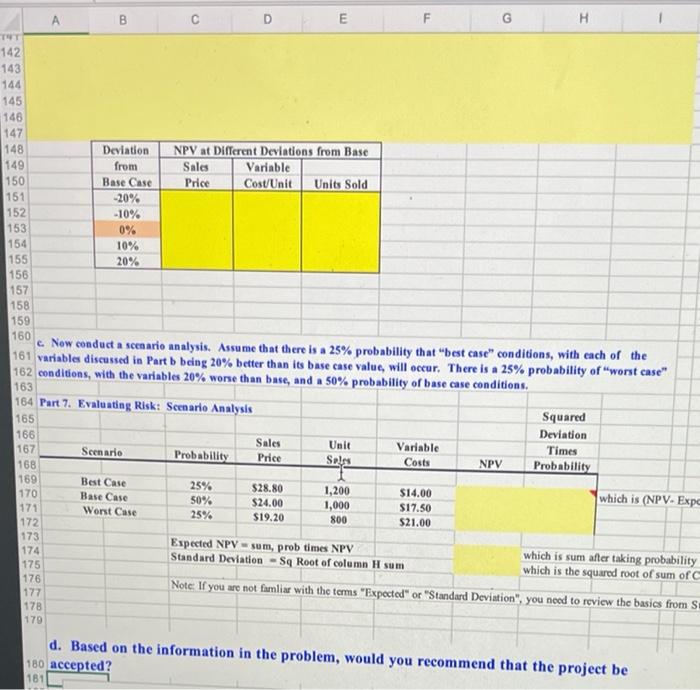
Webmasters.com has developed a powerful new server that would be used for corporations' Internet activities. It would cost $10 millien to bay the equipment necessary to manufacture the server, and it would require net working capital equal to 10% of sales. The servers would sell for $24,000 per unit, and Womasters believes that variable costs would amount to $17,500 pe uait. After the first year, the sales price and variable costs would increase at the inflation rate of 3%. The company's fixed costs would be $1 million per year, and would increase with inflation. It would take one year to buy the required cquipment and set up operatiens, and the server project would have a life of 4 years. If the project is undertaken, it must be continued for the entire 4 years. Also, the project's returns are expected to be highly corrdated with returns on the firm's other assets. The firm believes it ceuld sell 1,000 units per year. The equipment would be deprediated over a 5-year period, using MACRS rates. The eatimated market value of the equipment at the ead of the project's 4-year life is $500,000. Webmaster' federal-plus-state tax rate is 40%. Its cost of capital is 10% for average risk projects, defined as projects with a coefficient of variation for NPV between 0.8 and 1.2. Low risk projects are evaleated with a WACC of 8%, and high risk projects at 13%. a. Develep a spreadshect model and use it to find the project's NPV, IRR, and payback. Part 1. Inpet Data (in thousands of dollars) \begin{tabular}{|l|l} 28 & Equipment cost \\ 29 & Net Operating \\ 30 & Sales year sals \\ 31 & Variable cost \\ 32 & Fixed costs \\ \hline 33 & \\ \hline 34 & B.an n \\ \hline \end{tabular} graph in your analysis. b. Now conduct a sensitivity analysis to determine the sensitivity of NPV to changes in the sales price, variable costs per unit, and number of units sold. Set these variables' values at 10% and 20% above and below their base case value. Include a graph in your analysis. Part 6. Evaluating Risk: Sensitivity Analysis 1. Sensitivity of NPV to Changes in Inputs. Here we use an Excel "Data Table" to find NPV different unit sales, holding other thing constant. 126 First, copy and paste NPVs from sensivitiy analysis table to the table below. 127 Draw a line graph off from the table below. Note that there are only three variables to be shown in the tale below. 128 Your Y-axis should be NPV. Your X-axis should be "Deviations from Base value," 129 130 First, copy and paste NPVs from sensivitiy analysis table to the table below. 7 Draw a line graph off from the table below. Note that there are only three variables to be shown in the fale below. 8 Your Y-axis should be NPVs. Your X-axis should be "Deviations from Base value." c. New conduct a sceatio analysis. Assume that there is a 25% probability that "best case" conditions, with each of the variable discussed in Part b bcing 20% better than its base case value, will occur. There is a 25% probability of "worst case" conditions, with the variables 20% worse than base, and a 50% probability of base case conditions. d. Bascd on the information in the problem, would you recommend that the project be 30 accepted? Webmasters.com has developed a powerful new server that would be used for corporations' Internet activities. It would cost $10 millien to bay the equipment necessary to manufacture the server, and it would require net working capital equal to 10% of sales. The servers would sell for $24,000 per unit, and Womasters believes that variable costs would amount to $17,500 pe uait. After the first year, the sales price and variable costs would increase at the inflation rate of 3%. The company's fixed costs would be $1 million per year, and would increase with inflation. It would take one year to buy the required cquipment and set up operatiens, and the server project would have a life of 4 years. If the project is undertaken, it must be continued for the entire 4 years. Also, the project's returns are expected to be highly corrdated with returns on the firm's other assets. The firm believes it ceuld sell 1,000 units per year. The equipment would be deprediated over a 5-year period, using MACRS rates. The eatimated market value of the equipment at the ead of the project's 4-year life is $500,000. Webmaster' federal-plus-state tax rate is 40%. Its cost of capital is 10% for average risk projects, defined as projects with a coefficient of variation for NPV between 0.8 and 1.2. Low risk projects are evaleated with a WACC of 8%, and high risk projects at 13%. a. Develep a spreadshect model and use it to find the project's NPV, IRR, and payback. Part 1. Inpet Data (in thousands of dollars) \begin{tabular}{|l|l} 28 & Equipment cost \\ 29 & Net Operating \\ 30 & Sales year sals \\ 31 & Variable cost \\ 32 & Fixed costs \\ \hline 33 & \\ \hline 34 & B.an n \\ \hline \end{tabular} graph in your analysis. b. Now conduct a sensitivity analysis to determine the sensitivity of NPV to changes in the sales price, variable costs per unit, and number of units sold. Set these variables' values at 10% and 20% above and below their base case value. Include a graph in your analysis. Part 6. Evaluating Risk: Sensitivity Analysis 1. Sensitivity of NPV to Changes in Inputs. Here we use an Excel "Data Table" to find NPV different unit sales, holding other thing constant. 126 First, copy and paste NPVs from sensivitiy analysis table to the table below. 127 Draw a line graph off from the table below. Note that there are only three variables to be shown in the tale below. 128 Your Y-axis should be NPV. Your X-axis should be "Deviations from Base value," 129 130 First, copy and paste NPVs from sensivitiy analysis table to the table below. 7 Draw a line graph off from the table below. Note that there are only three variables to be shown in the fale below. 8 Your Y-axis should be NPVs. Your X-axis should be "Deviations from Base value." c. New conduct a sceatio analysis. Assume that there is a 25% probability that "best case" conditions, with each of the variable discussed in Part b bcing 20% better than its base case value, will occur. There is a 25% probability of "worst case" conditions, with the variables 20% worse than base, and a 50% probability of base case conditions. d. Bascd on the information in the problem, would you recommend that the project be 30 accepted Step by Step Solution
There are 3 Steps involved in it
Step: 1

Get Instant Access to Expert-Tailored Solutions
See step-by-step solutions with expert insights and AI powered tools for academic success
Step: 2

Step: 3
Ace Your Homework with AI
Get the answers you need in no time with our AI-driven, step-by-step assistance
Get Started