Answered step by step
Verified Expert Solution
Link Copied!

Question

1 Approved Answer

Please answer what is asked in the picture below. Thank you so much. Consider the frequency distribution below. Classes 5 - 9 5 10 -

Please answer what is asked in the picture below. Thank you so much.
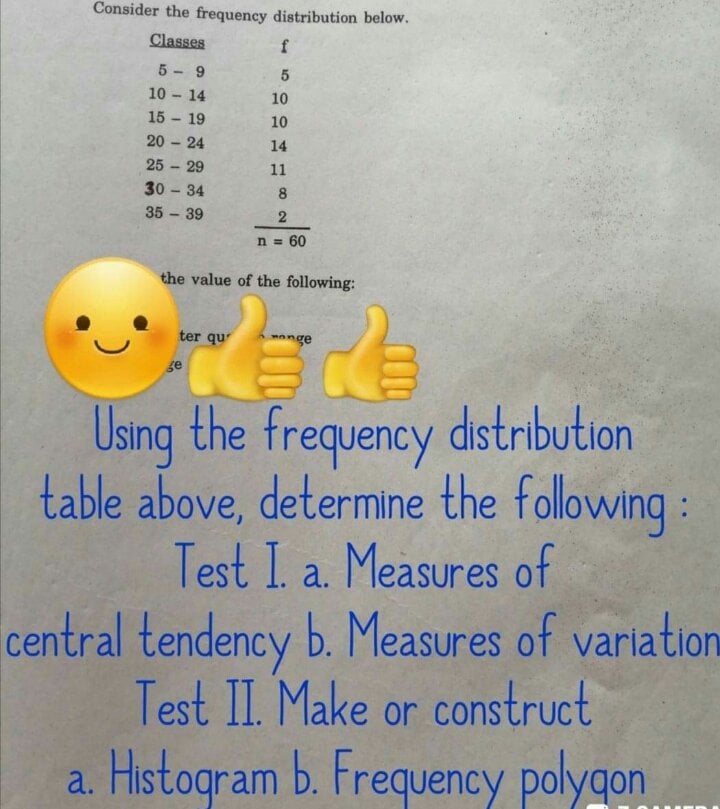
image text in transcribed
Consider the frequency distribution below. Classes 5 - 9 5 10 - 14 10 15 - 19 10 20 - 24 14 25 - 29 11 30 - 34 35 - 39 2 n = 60 the value of the following: ter qu ge Using the frequency distribution table above, determine the following : Test I. a. Measures of central tendency b. Measures of variation Test II. Make or construct a. Histogram b. Frequency polygon

Step by Step Solution

There are 3 Steps involved in it

Step: 1

blur-text-image

Get Instant Access to Expert-Tailored Solutions

See step-by-step solutions with expert insights and AI powered tools for academic success

Step: 2

blur-text-image_2

Step: 3

blur-text-image_3

Ace Your Homework with AI

Get the answers you need in no time with our AI-driven, step-by-step assistance

Get Started

Recommended Textbook for

Precalculus, Enhanced

Authors: Cynthia Y Young

3rd Edition

1119339510, 9781119339519

More Books

Students also viewed these Mathematics questions