PLEASE answer with calculations from Parts A & B, as well as answers for discussion questions!
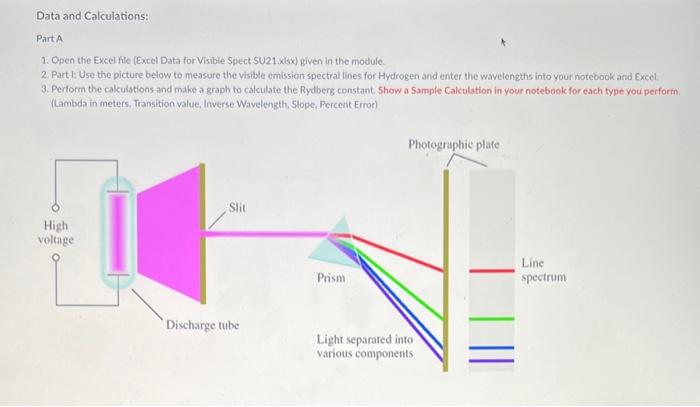
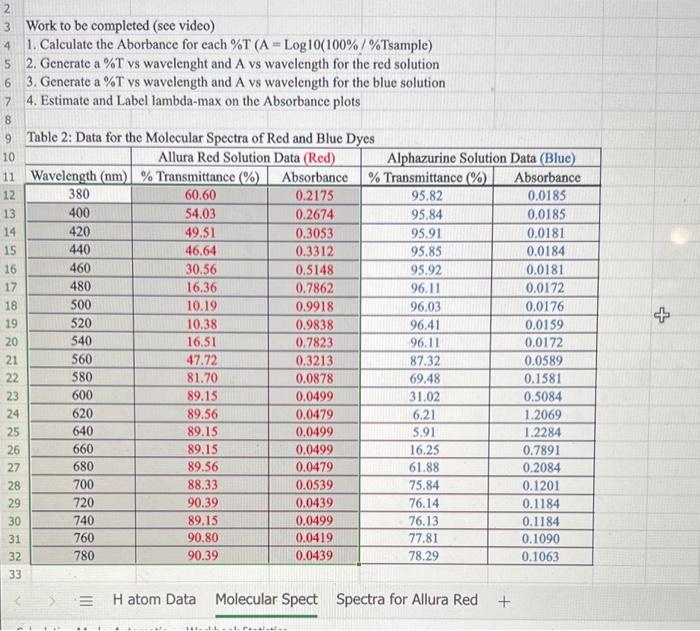
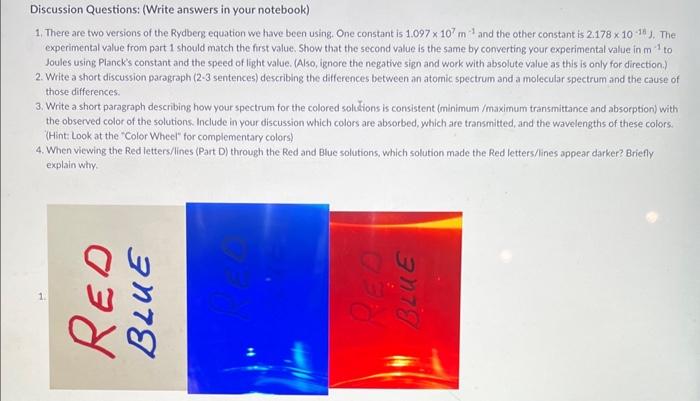
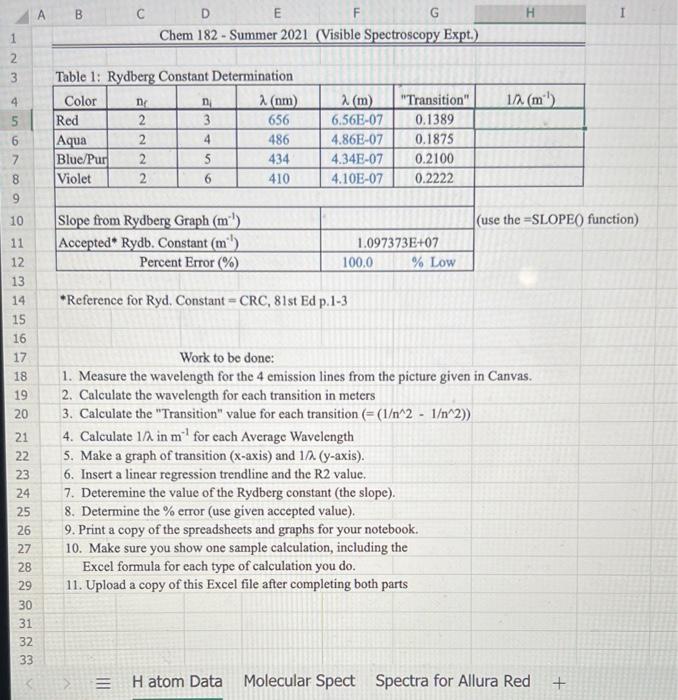
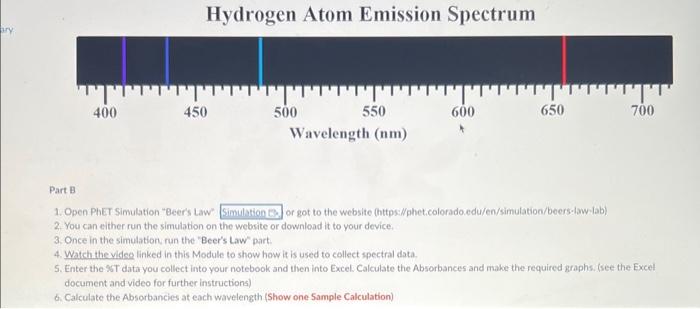
Data and Calculations: Part A 1. Open the Excel file (Excel Data for Visible Spect SU21 xlsx) given in the module. 2. Part 1: Use the picture below to measure the visible emission spectral lines for Hydrogen and enter the wavelengths into your notebook and Excel. 3. Perform the calculations and make a graph to calculate the Rydberg constant. Show a Sample Cakculation in your notebook for each type you perform. (Lambda in meters, Transition value, Inverse Wavelength, Slope, Percent Error) Part B 1. Open Pher Simulation "Beers Law" or got to the website (httpsi/fphetcolorado.edu/en/simulation/beers.law/ab) 2. You can either run the simulation on the website or download it to your device, 3. Once in the simulation run the "Beer's Law" part. 4. Watch the videe linked in this Module to show how it is used to collect spectral data. 5. Enter the ST data you collect into your notebook and then into Excel. Calculate the Absorbances and make the required graphs. (see the Excel document and video for further instructions) 6. Calculate the Absorbancies at each wavelength (Show one 5ample Calculation) Work to be completed (see video) 1. Calculate the Aborbance for each \%T ( A=log10(100%/% Tsample) 2. Generate a \% vs wavelenght and A vs wavelength for the red solution 3. Generate a %T vs wavelength and A vs wavelength for the blue solution 4. Estimate and Label lambda-max on the Absorbance plots Discussion Questions: (Write answers in your notebook) 1. There are two versions of the Rydberg equation we have been using. One constant is 1.097107m1 and the other constant is 2.1781016 J, The experimental value from part 1 should match the first value. Show that the second value is the same by converting your experimental value in m1 to Joules using. Planck's constant and the speed of light value. (Also, ignore the negative sign and work with absolute value as this is only for direction.) 2. Write a short discussion paragraph ( 23 sentences) describing the differences between an atomic spectrum and a molecular spectrum and the cause of those differences. 3. Write a short paragraph describing how your spectrum for the colored solvions is consistent (minimum /maximum transmittance and absorption) with the observed color of the solutions. Include in your discussion which colors are absorbed, which are transmitted, and the wavelengths of these colors. (Hint: Look at the "Color Wheel" for complementary colors) 4. When viewing the Red letters/lines (Part D) through the Red and Blue solutions, which solution made the Red letters/lines appear darker? Briefly explain why. Reference for Ryd. Constant = CRC, 81 st Ed p.1-3 Work to be done: 1. Measure the wavelength for the 4 emission lines from the picture given in Canvas. 2. Calculate the wavelength for each transition in meters 3. Calculate the "Transition" value for each transition (=(1212)) 4. Calculate 1/ in m1 for each Average Wavelength 5. Make a graph of transition ( x-axis) and 1/ ( y-axis). 6. Insert a linear regression trendline and the R2 value. 7. Deteremine the value of the Rydberg constant (the slope). 8. Determine the % error (use given accepted value). 9. Print a copy of the spreadsheets and graphs for your notebook. 10. Make sure you show one sample calculation, including the Excel formula for each type of calculation you do. 11. Upload a copy of this Excel file after completing both parts Data and Calculations: Part A 1. Open the Excel file (Excel Data for Visible Spect SU21 xlsx) given in the module. 2. Part 1: Use the picture below to measure the visible emission spectral lines for Hydrogen and enter the wavelengths into your notebook and Excel. 3. Perform the calculations and make a graph to calculate the Rydberg constant. Show a Sample Cakculation in your notebook for each type you perform. (Lambda in meters, Transition value, Inverse Wavelength, Slope, Percent Error) Part B 1. Open Pher Simulation "Beers Law" or got to the website (httpsi/fphetcolorado.edu/en/simulation/beers.law/ab) 2. You can either run the simulation on the website or download it to your device, 3. Once in the simulation run the "Beer's Law" part. 4. Watch the videe linked in this Module to show how it is used to collect spectral data. 5. Enter the ST data you collect into your notebook and then into Excel. Calculate the Absorbances and make the required graphs. (see the Excel document and video for further instructions) 6. Calculate the Absorbancies at each wavelength (Show one 5ample Calculation) Work to be completed (see video) 1. Calculate the Aborbance for each \%T ( A=log10(100%/% Tsample) 2. Generate a \% vs wavelenght and A vs wavelength for the red solution 3. Generate a %T vs wavelength and A vs wavelength for the blue solution 4. Estimate and Label lambda-max on the Absorbance plots Discussion Questions: (Write answers in your notebook) 1. There are two versions of the Rydberg equation we have been using. One constant is 1.097107m1 and the other constant is 2.1781016 J, The experimental value from part 1 should match the first value. Show that the second value is the same by converting your experimental value in m1 to Joules using. Planck's constant and the speed of light value. (Also, ignore the negative sign and work with absolute value as this is only for direction.) 2. Write a short discussion paragraph ( 23 sentences) describing the differences between an atomic spectrum and a molecular spectrum and the cause of those differences. 3. Write a short paragraph describing how your spectrum for the colored solvions is consistent (minimum /maximum transmittance and absorption) with the observed color of the solutions. Include in your discussion which colors are absorbed, which are transmitted, and the wavelengths of these colors. (Hint: Look at the "Color Wheel" for complementary colors) 4. When viewing the Red letters/lines (Part D) through the Red and Blue solutions, which solution made the Red letters/lines appear darker? Briefly explain why. Reference for Ryd. Constant = CRC, 81 st Ed p.1-3 Work to be done: 1. Measure the wavelength for the 4 emission lines from the picture given in Canvas. 2. Calculate the wavelength for each transition in meters 3. Calculate the "Transition" value for each transition (=(1212)) 4. Calculate 1/ in m1 for each Average Wavelength 5. Make a graph of transition ( x-axis) and 1/ ( y-axis). 6. Insert a linear regression trendline and the R2 value. 7. Deteremine the value of the Rydberg constant (the slope). 8. Determine the % error (use given accepted value). 9. Print a copy of the spreadsheets and graphs for your notebook. 10. Make sure you show one sample calculation, including the Excel formula for each type of calculation you do. 11. Upload a copy of this Excel file after completing both parts


