please answer with code thanks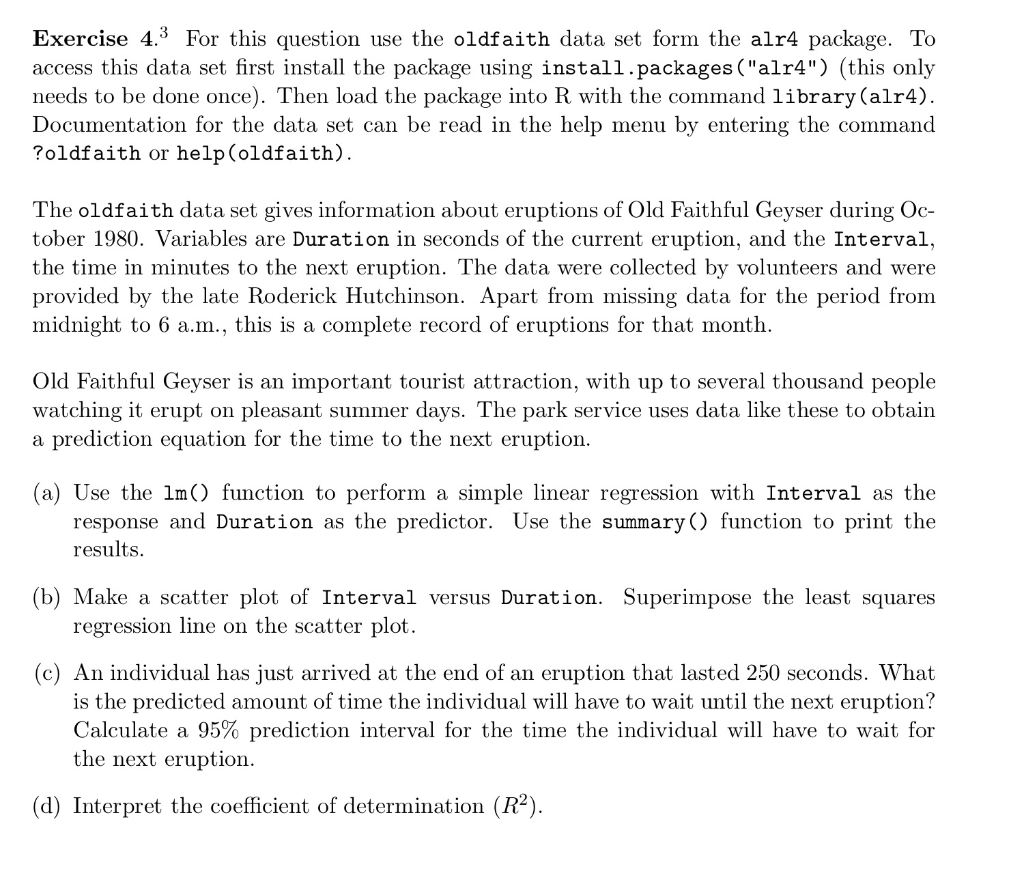
Exercise 4.3 For this question use the oldfaith data set form the alr4 package. To access this data set first install the package using install.packages ("alr4") (this only needs to be done once). Then load the package into R with the command library (alr4) Documentation for the data set can be read in the help menu by entering the command ?oldfaith or help(oldfaith) The oldfaith data set gives information about eruptions of Old Faithful Geyser during Oc- tober 1980. Variables are Duration in seconds of the current eruption, and the Interval the time in minutes to the next eruption. The data were collected by volunteers and were provided by the late Roderick Hutchinson. Apart from missing data for the period from midnight to 6 a.m., this is a complete record of eruptions for that month Old Faithful Geyser is an important tourist attraction, with up to several thousand people watching it erupt on pleasant summer days. The park service uses data like these to obtain a prediction equation for the time to the next eruption (a) Use the lm() function to perform a simple linear regression with Interval as the response and Duration as the predictor. Use the summary () function to print the results (b) Make a scatter plot of Interval versus Duration. Superimpose the least squares regression line on the scatter plot (c) An individual has just arrived at the end of an eruption that lasted 250 seconds. What is the predicted amount of time the individual will have to wait until the next eruption? Calculate a 95% prediction interval for the time the individual will have to wait for the next eruption (d) Interpret the coefficient of determination (R2) Exercise 4.3 For this question use the oldfaith data set form the alr4 package. To access this data set first install the package using install.packages ("alr4") (this only needs to be done once). Then load the package into R with the command library (alr4) Documentation for the data set can be read in the help menu by entering the command ?oldfaith or help(oldfaith) The oldfaith data set gives information about eruptions of Old Faithful Geyser during Oc- tober 1980. Variables are Duration in seconds of the current eruption, and the Interval the time in minutes to the next eruption. The data were collected by volunteers and were provided by the late Roderick Hutchinson. Apart from missing data for the period from midnight to 6 a.m., this is a complete record of eruptions for that month Old Faithful Geyser is an important tourist attraction, with up to several thousand people watching it erupt on pleasant summer days. The park service uses data like these to obtain a prediction equation for the time to the next eruption (a) Use the lm() function to perform a simple linear regression with Interval as the response and Duration as the predictor. Use the summary () function to print the results (b) Make a scatter plot of Interval versus Duration. Superimpose the least squares regression line on the scatter plot (c) An individual has just arrived at the end of an eruption that lasted 250 seconds. What is the predicted amount of time the individual will have to wait until the next eruption? Calculate a 95% prediction interval for the time the individual will have to wait for the next eruption (d) Interpret the coefficient of determination (R2)