Answered step by step
Verified Expert Solution
Question
1 Approved Answer
please answer with excel formulas thanks THE REAL ESTATE SALES PRICE CASE A real estate agency collects the data concerning y= sales price of a


please answer with excel formulas thanks
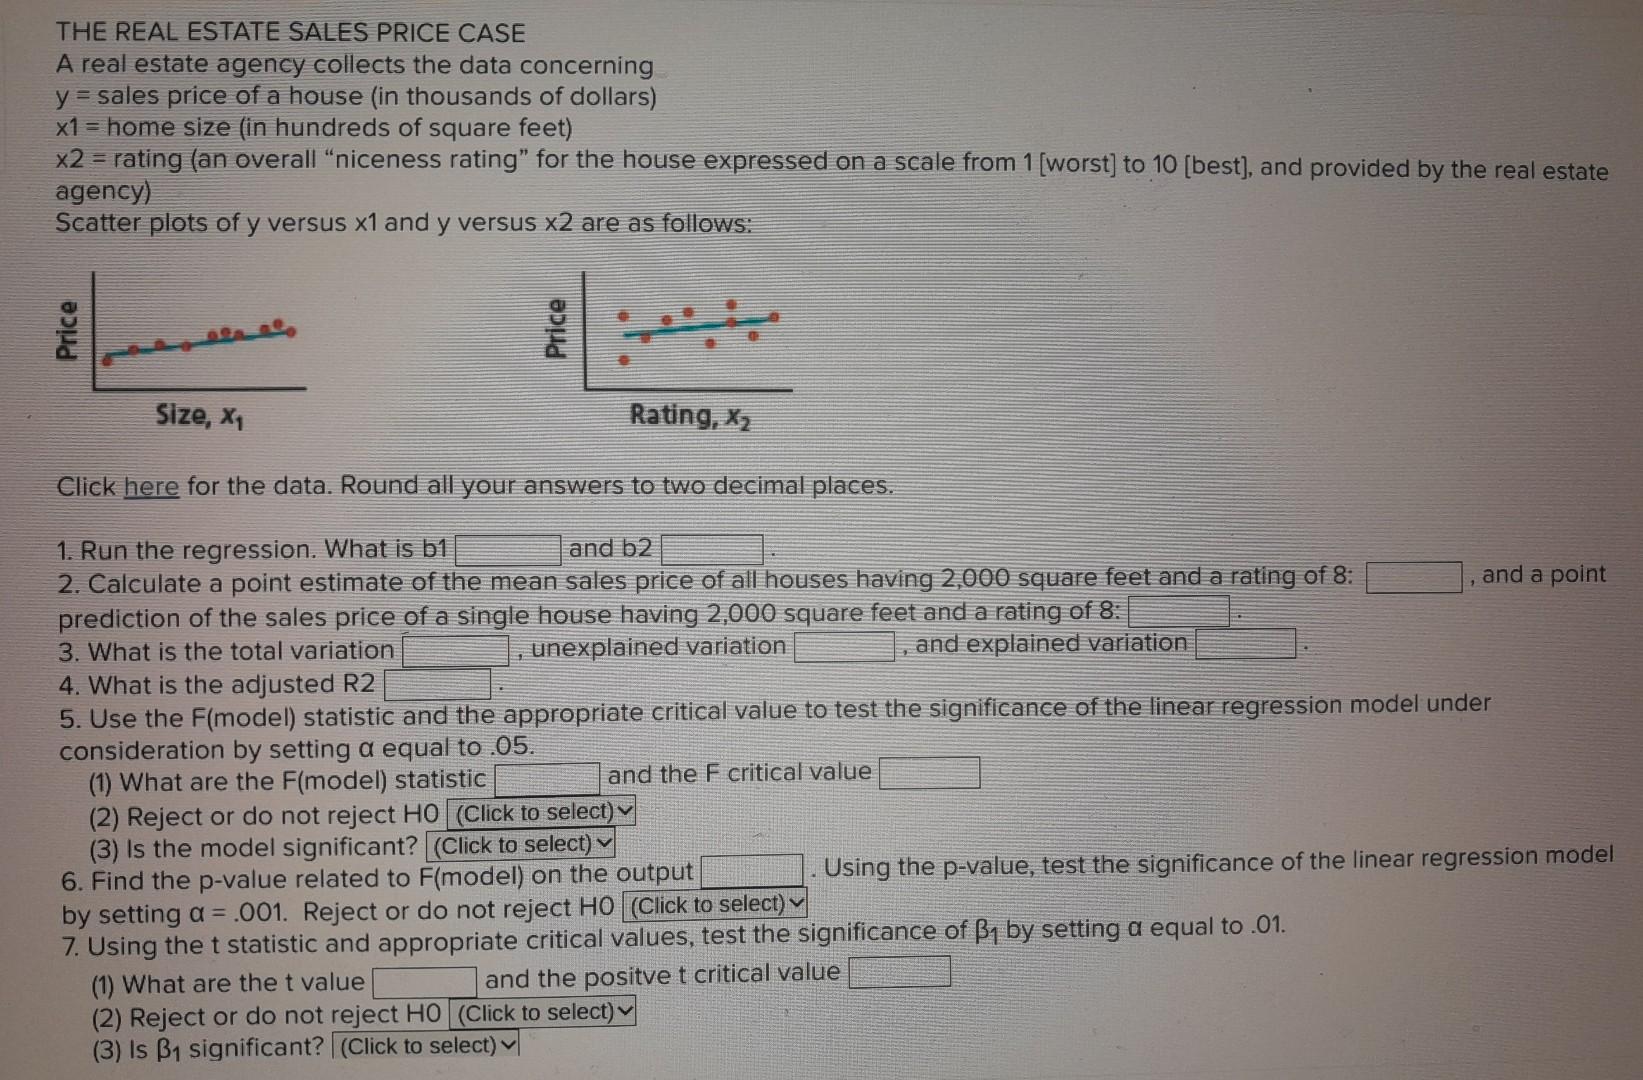
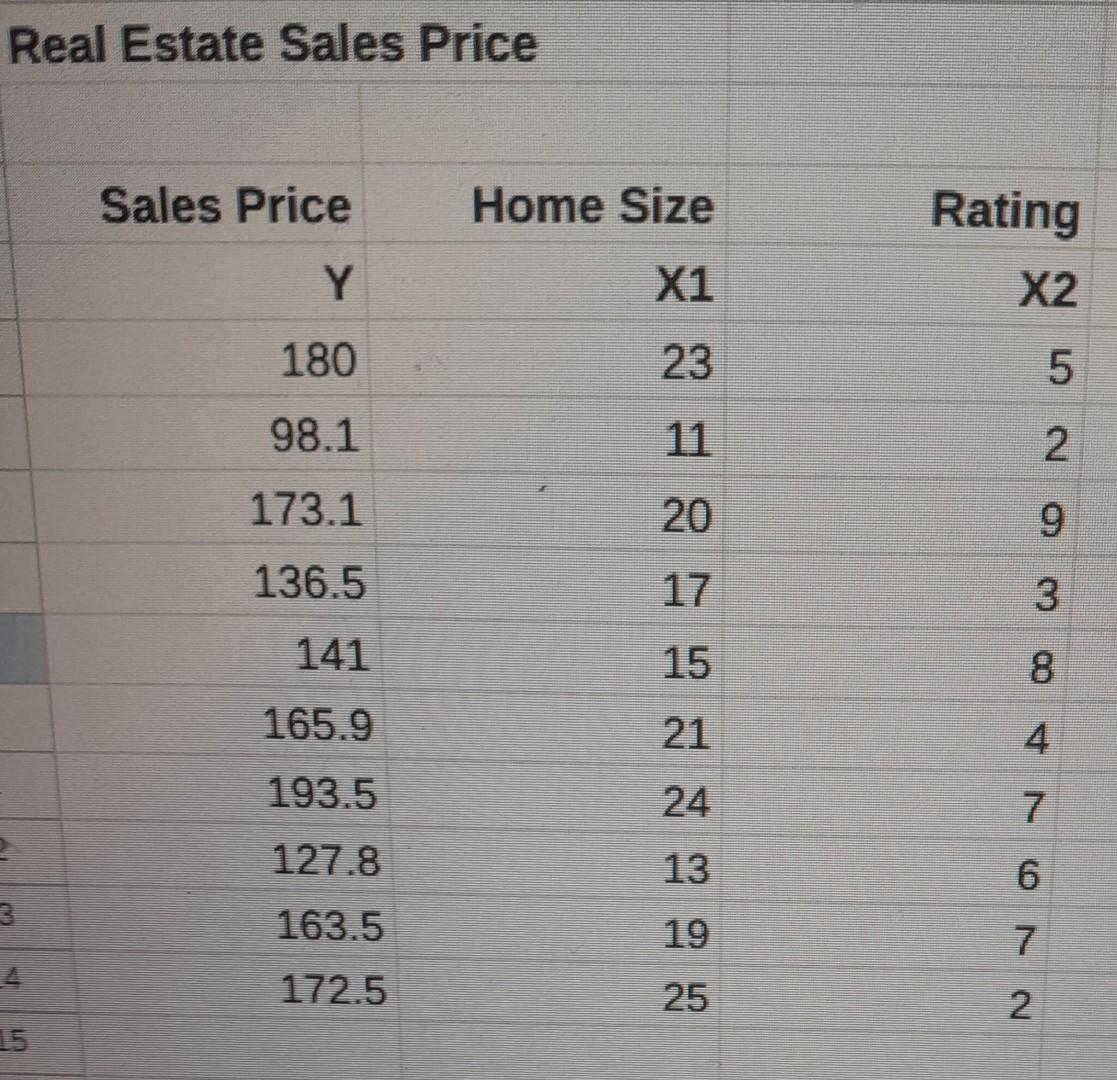
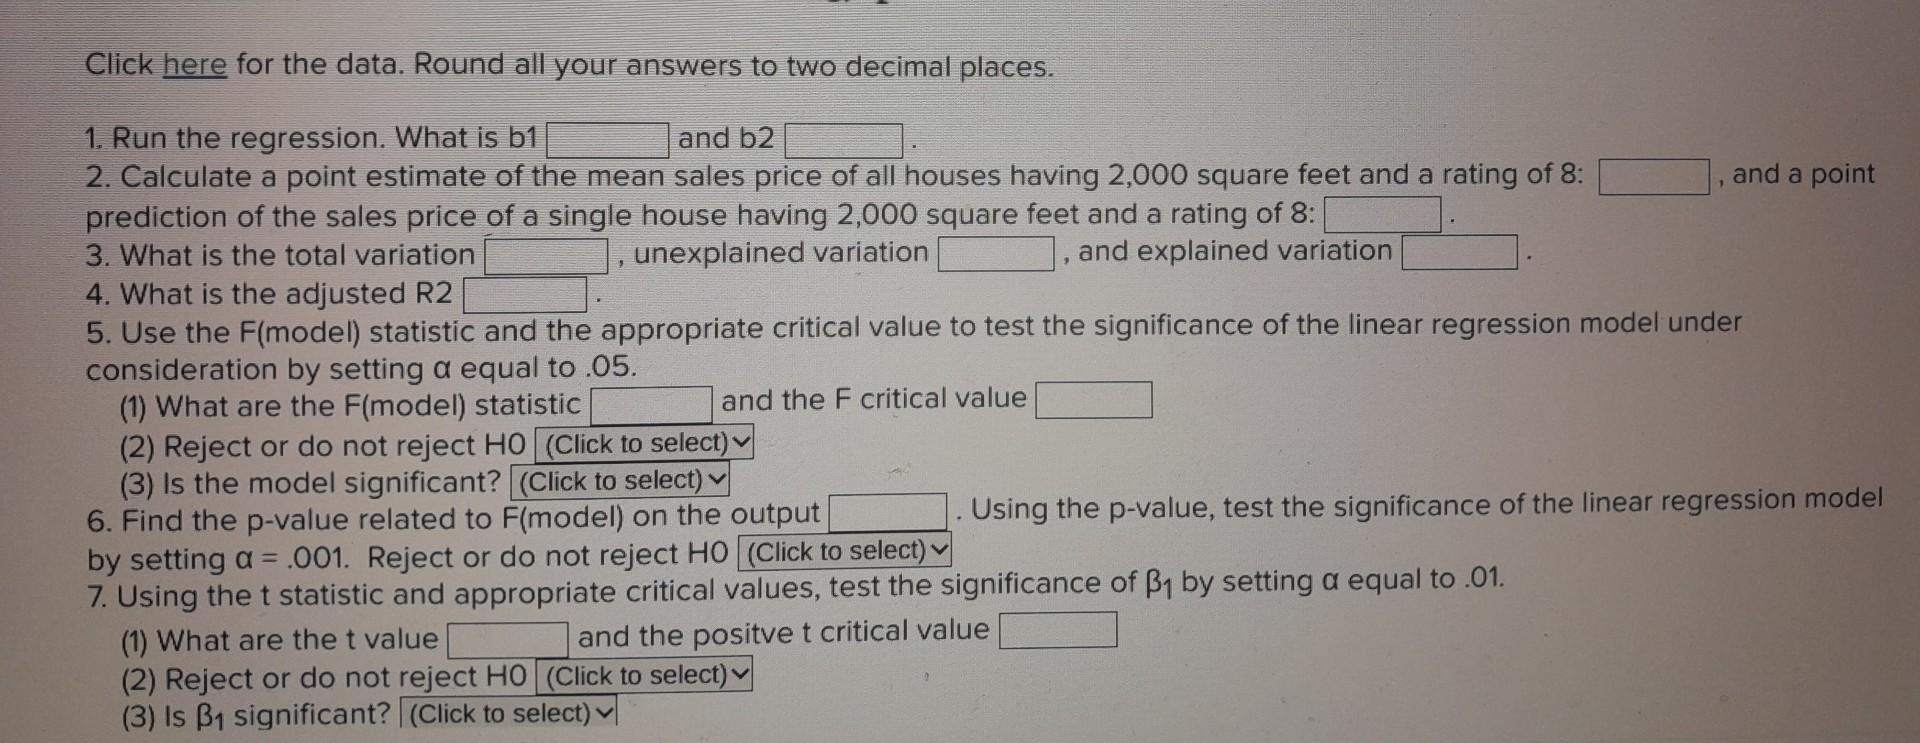
THE REAL ESTATE SALES PRICE CASE A real estate agency collects the data concerning y= sales price of a house (in thousands of dollars) x1= home size (in hundreds of square feet) 2 = rating (an overall "niceness rating" for the house expressed on a scale from 1 [worst] to 10 [best], and provided by the real estate agency) Scatter plots of y versus x1 and y versus x2 are as follows: Click here for the data. Round all your answers to two decimal places. 1. Run the regression. What is b1 and b2 2. Calculate a point estimate of the mean sales price of all houses having 2,000 square feet and a rating of 8 : , and a point prediction of the sales price of a single house having 2,000 square feet and a rating of 8 : 3. What is the total variation , unexplained variation and explained variation 4. What is the adjusted R2 5. Use the F (model) statistic and the appropriate critical value to test the significance of the linear regression model under consideration by setting equal to .05 . (1) What are the F( model) statistic (2) Reject or do not reject \( \mathrm { HO } \longdiv { \text { (Click to select) } ~ } \) (3) Is the model significant? 6. Find the p-value related to F (model) on the output Using the p-value, test the significance of the linear regression model by setting =.001. Reject or do not reject HO (Click to select) v. Using the t statistic and appropriate critical values, test the signicance of 1 by setting equal to 01 . (1) What are the t value and the positve t critical value (2) Reject or do not reject HO (3) Is 1 significant? (Click to select) Real Estate Sales Price Click here for the data. Round all your answers to two decimal places. 1. Run the regression. What is b1 and b2 2. Calculate a point estimate of the mean sales price of all houses having 2,000 square feet and a rating of 8 : and a point prediction of the sales price of a single house having 2,000 square feet and a rating of 8 : 3. What is the total variation , unexplained variation , and explained variation 4. What is the adjusted R2 5. Use the F (model) statistic and the appropriate critical value to test the significance of the linear regression model under consideration by setting equal to .05 . (1) What are the F( model) statistic and the F critical value (2) Reject or do not reject HO (3) Is the model significant? 6. Find the p-value related to F (model) on the output Using the p-value, test the significance of the linear regression model by setting =.001. Reject or do not reject HO (Click to select)v 7. Using the t statistic and appropriate critical values, test the significance of 1 by setting equal to .01 . (1) What are the t value and the positve t critical value (2) Reject or do not reject HO (Click to select) (3) Is 1 significant? (Clicktoselect)Step by Step Solution
There are 3 Steps involved in it
Step: 1

Get Instant Access to Expert-Tailored Solutions
See step-by-step solutions with expert insights and AI powered tools for academic success
Step: 2

Step: 3

Ace Your Homework with AI
Get the answers you need in no time with our AI-driven, step-by-step assistance
Get Started


