

Answered step by step
Verified Expert Solution
Question
1 Approved Answer
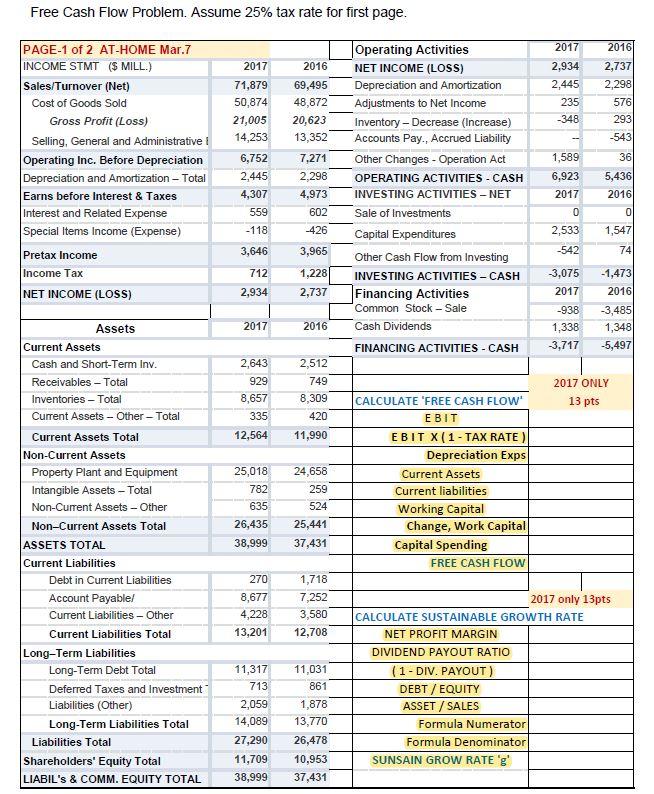
Please answered the highlighted. Thank you kindly! Free Cash Flow Problem. Assume 25% tax rate for first page. 2017 2016 2017 2016 71,879 50,874 21,005
Please answered the highlighted. Thank you kindly!
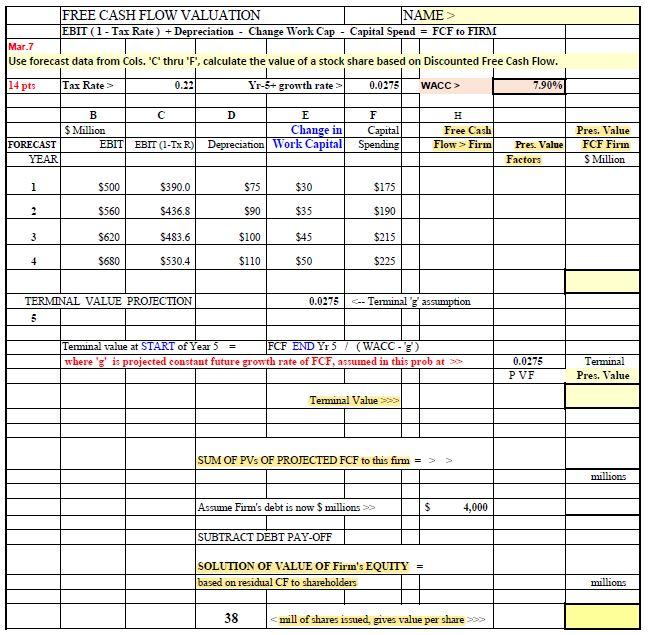
Free Cash Flow Problem. Assume 25% tax rate for first page. 2017 2016 2017 2016 71,879 50,874 21,005 14,253 PAGE-1 of 2 AT-HOME Mar. 7 INCOME STMT (5 MILL.) Sales/Turnover (Net) Cost of Goods Sold Gross Profit (Loss) Selling, General and Administrative i Operating Inc. Before Depreciation Depreciation and Amortization - Total Earns before Interest & Taxes Interest and Related Expense Special Items Income (Expense) 2,934 2,445 235 -348 69,495 48,872 20,623 13,352 2,737 2,298 576 293 -543 7,271 2.298 6,752 2,445 4,307 559 1,589 6,923 2017 36 5,436) 2016 Operating Activities NET INCOME (LOSS) Depreciation and Amortization Adjustments to Net Income Inventory - Decrease (Increase) Accounts Pay., Accrued Liability Other Changes - Operation Act OPERATING ACTIVITIES - CASH INVESTING ACTIVITIES - NET Sale of Investments Capital Expenditures Other Cash Flow from Investing INVESTING ACTIVITIES - CASH Financing Activities Common Stock - Sale Cash Dividends FINANCING ACTIVITIES - CASH 4,973 602 0 0 2,533 -118 -426 1,547 74 Pretax Income 3,646 3,965 -542 Income Tax 712 1,228 3,075 2017 NET INCOME (LOSS) 2,934 2,737 -1,473 2016 -3,485 1,348 -5,497 2017 -938 1,338 3,717 2016 2,643 929 8,657 335 2,512 749 8,309 420 2017 ONLY 13 pts 12,564 11,990 25,018 782 635 26,435 24,658 259 524 25,441 37,431 Assets Current Assets Cash and Short-Term Inv. Receivables - Total Inventories - Total Current Assets - Other - Total Current Assets Total Non-Current Assets Property Plant and Equipment Intangible Assets - Total Non-Current Assets - Other Non-Current Assets Total ASSETS TOTAL Current Liabilities Debt in Current Liabilities Account Payable/ Current Liabilities - Other Current Liabilities Total Long-Term Liabilities Long-Term Debt Total Deferred Taxes and Investment Liabilities (Other) Long-Term Liabilities Total Liabilities Total Shareholders' Equity Total LIABIL'S & COMM. EQUITY TOTAL CALCULATE 'FREE CASH FLOW EBIT EBIT X(1 - TAXR Depreciation Exps Current Assets Current liabilities Working Capital Change, Work Capital Capital Spending FREE CASH FLOW 38,999 270 8,677 4,228 13,201 1,718 7,252 3,580 12,708 11,317 713 2,059 14,089 27,290 11,709 38,999 11,031 861 1,878 13,770 2017 only 13pts CALCULATE SUSTAINABLE GROWTH RATE NET PROFIT MARGIN DIVIDEND PAYOUT RATIO (1 - DIV. PAYOUT) DEBT / EQUITY ASSET / SALES Formula Numerator Formula Denominator SUNSAIN GROW RATE'g' 26,478 10,953 37,431 FREE CASH FLOW VALUATION NAME> EBIT (1 - Tax Rate) + Depreciation - Change Work Cap - Capital Spend = FCF to FIRM Mar. 7 Use forecast data from Cols. 'C' thru 'F', calculate the value of a stock share based on Discounted Free Cash Flow. 14 pts Tax Rate> 0.22 Yr-8+ growth rate> 0.0275 WACC > 7.90% B $ Million EBIT D E Change in Depreciation Work Capital F Capital Spending H Free Cash Flow > Firm EBIT (1-TX R) FORECAST YEAR Pres. Value Factors Pres. Value FCF Firm S Million 1 $500 $390.0 $75 $30 $175 2 $560 $436.8 $90 $35 $190 3 $620 S483.6 $100 $45 $215 + $680 $530.4 $110 $50 $225 0.0275 -- Terminal 'z assumption TERMINAL VALUE PROJECTION 5 Terminal value at START of Year 5 = FCF END Yr 5 / (WACC-3) where 'g' is projected constant future growth rate of FCF, assuined in this prob at >> 0.0275 PVF Terminal Pres. Value Terminal Value SUM OF PVs OF PROJECTED FCF to this firm = millions Assume Firm's debt is now $ millions >> $ 4,000 SUBTRACT DEBT PAY-OFF SOLUTION OF VALUE OF Firin's EQUITY = based on residual CF to shareholders millions 38Step by Step Solution
There are 3 Steps involved in it
Step: 1

Get Instant Access to Expert-Tailored Solutions
See step-by-step solutions with expert insights and AI powered tools for academic success
Step: 2

Step: 3
Ace Your Homework with AI
Get the answers you need in no time with our AI-driven, step-by-step assistance
Get Started
Horngren S Financial And Managerial Accounting The Managerial Chapters RENTAL EDITION
Authors: Miller-Nobles
1st Edition
0136503748, 978-0136503743