Please anwer question 1-4. Asnwer all questions neatly and explain. i will provide exhibits 5-7 below. answer all questions then I will upvote. Thank you !
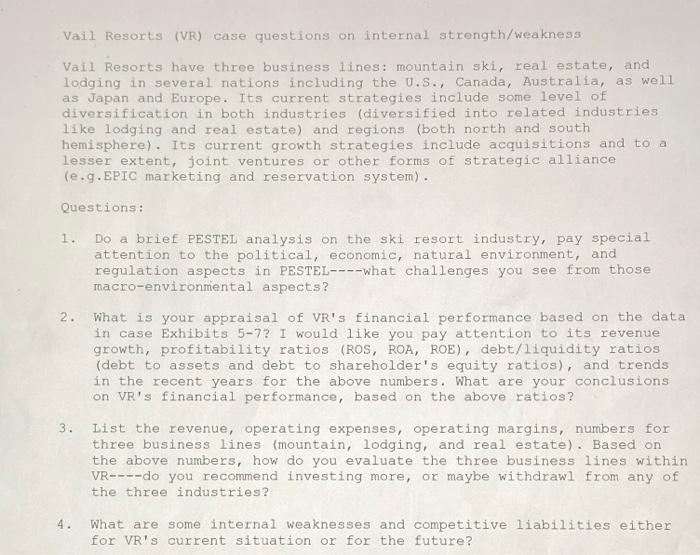
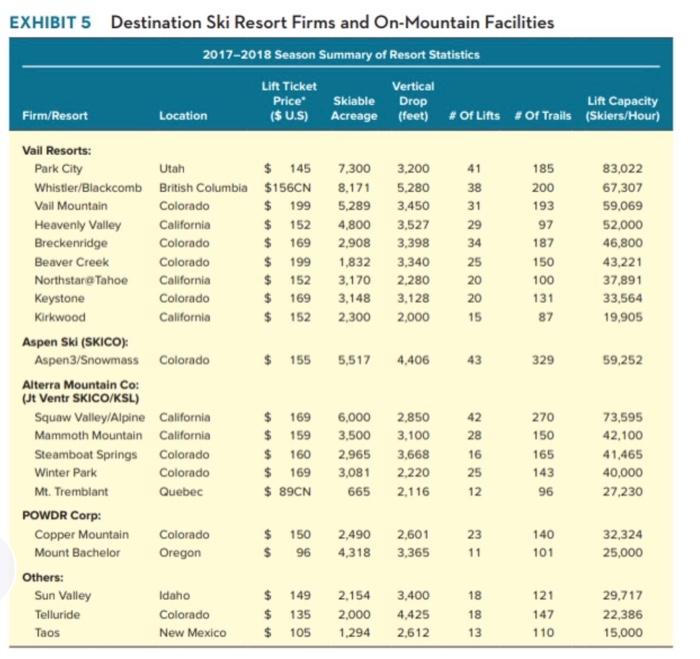
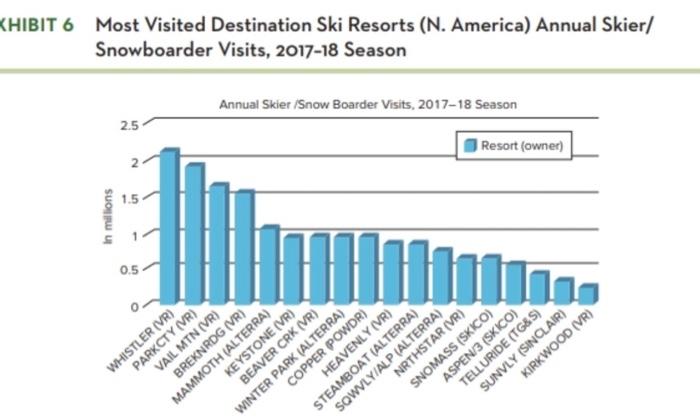
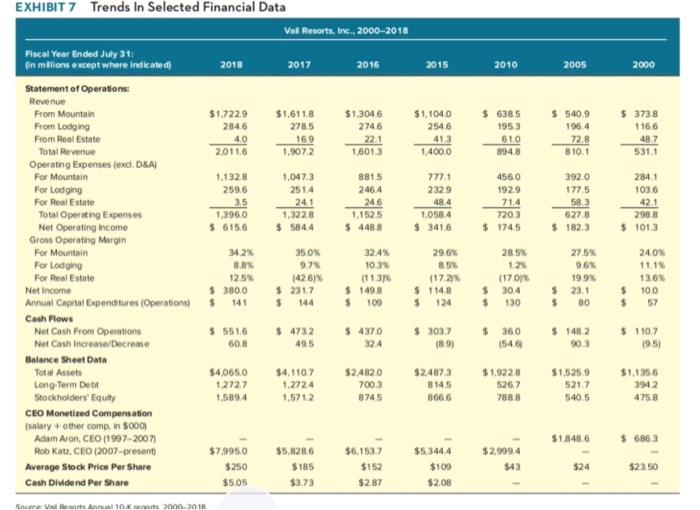
Vail Resorts (VR) case questions on internal strength/weakness Vail Resorts have three business lines: mountain ski, real estate, and lodging in several nations including the U.S., Canada, Australia, as well as Japan and Europe. Its current strategies include some level of diversification in both industries (diversified into related industries like lodging and real estate) and regions (both north and south hemisphere). Its current growth strategies include acquisitions and to a lesser extent, joint ventures or other forms of strategic alliance (e.g.EPIC marketing and reservation system). Questions: 1. Do a brief PESTEL analysis on the ski resort industry, pay special attention to the political, economic, natural environment, and regulation aspects in PESTEL----what challenges you see from those macro-environmental aspects? 2. What is your appraisal of VR's financial performance based on the data in case Exhibits 5-7? I would like you pay attention to its revenue growth, profitability ratios (ROS, ROA, ROE), debt/liquidity ratios (debt to assets and debt to shareholder's equity ratios), and trends in the recent years for the above numbers. What are your conclusions on VR's financial performance, based on the above ratios? 3. List the revenue, operating expenses, operating margins, numbers for three business lines (mountain, lodging, and real estate). Based on the above numbers, how do you evaluate the three business lines within VR----do you recommend investing more, or maybe withdrawl from any of the three industries? 4. What are some internal weaknesses and competitive liabilities either for VR's current situation or for the future? EXHIBIT 5 Destination Ski Resort Firms and On-Mountain Facilities 2017-2018 Season Summary of Resort Statistics Lift Ticket Vertical Price Skiable Drop Lift Capacity ($ U.S) Acreage (feet) #Of Lifts Of Trails (Skiers/Hour) Firm/Resort Location 7,300 3,200 41 185 83,022 8,171 5,280 38 200 67,307 5,289 3.450 31 193 59,069 3,527 29 97 Vail Resorts: Park City Utah $ 145 Whistler/Blackcomb British Columbia $156CN Vail Mountain Colorado $ 199 Heavenly Valley California $ 152 Breckenridge Colorado $ 169 Beaver Creek Colorado $ 199 Northstaro Tahoe California $ 152 Keystone Colorado $ 169 Kirkwood California $ 152 4.800 2,908 52,000 46,800 3,398 34 187 1,832 3,340 25 150 43.221 2,280 20 100 37,891 3,170 3,148 3.128 20 131 33,564 2,300 2,000 15 87 19,905 $ 1555,517 4,406 43 329 59,252 Aspen Ski (SKICO): Aspen 3/Snowmass Colorado Alterra Mountain Co: (Jt Vente SKICO/KSL) Squaw Valley/Alpine California Mammoth Mountain California Steamboat Springs Colorado Winter Park Colorado $ 169 2,850 42 270 6,000 3,500 73,595 42,100 $ 159 3.100 28 150 $ 160 3,668 16 165 2,965 3,081 $ 169 2,220 25 143 41,465 40,000 27,230 Mt. Tremblant Quebec $ 89CN 665 2,116 12 96 POWDR Corp: Copper Mountain Colorado 2,601 23 140 $ 150 2,490 $ 96 4,318 32,324 25,000 Mount Bachelor Oregon 3,365 11 101 Others: Sun Valley Telluride Idaho $ 149 2.154 3.400 18 121 29.717 Colorado 4,425 18 147 22,386 $ 135 $ 105 2,000 1.294 Taos New Mexico 2,612 13 110 15,000 KHIBIT 6 Most Visited Destination Ski Resorts (N. America) Annual Skier/ Snowboarder Visits, 2017-18 Season Annual Skier /Snow Boarder Visits, 2017-18 Season 2.5 2 Resort (owner) 2 SUO un 0.5 o WHISTLER (VR) PARKCTY (VR) VAIL MTN (VR) BREKNRDG (VR) MAMMOTH (ALTERRA) KEYSTONE (VR) BEAVER CRK (VR) WINTER PARK (ALTERRA) COPPER POWDR) HEAVENLY (VR) STEAMBOAT (ALTERRA) SOWVLY/ALP (ALTERRA) NRTHSTAR (VR) SNOMASS(SKICO) ASPEN 3 (SKICO) TELLURIDE (TG&S) SUNVLY (SINCLAIR) KIRKWOOD (VR) EXHIBIT 7 Trends in Selected Financial Data Val Resorts, Inc., 2000-2018 Fiscal Year Ended July 31: in milions except where indicated 2018 2017 2016 2015 2010 2005 2000 Statement of Operations: Revenue From Mountain From Lodging From Real Estate $1.1040 $1,7229 284.6 $1,6118 2785 254.6 $1,3046 2746 221 1.6013 $ 6385 1953 610 9948 $ 5409 195.4 72.8 $ 3738 1166 487 413 40 2011.6 16.9 1.0072 Total Revenue 1,400.0 810.1 531.1 1,0473 8815 777.1 4560 284.1 2514 246.4 2329 1929 3920 177.5 583 1036 1.1328 259.6 35 1,3960 $ 615.6 24.1 48 4 71.4 42.1 7203 Operating Expenses (end. D&A) For Mountain For Lodging For Real Estate Total Operating Expenses Net Operating income Gross Operating Margin For Mountain For Lodging For Real Estate 246 1.1525 $4488 627 8 298 B 1.3228 $ 5844 1,0584 $ 3416 $ 1745 $ 1823 $ 1013 34.2 28.5% 24.0% 8.8% 12.5% 380.0 35 ON 9.7 (426)% $ 2317 $ 144 324 10.3% (11376 $ 1498 $ 109 29.6% 8. (17.2% $ 1148 $ 124 12 (1701% $ 304 $ 130 275% 9.6% 19.9% $ 23.1 $ 80 11.11 13.6 $ 100 Net Income Annual Capital Expenditures (Operations $ 141 Cash Flows Net Cash From Operations Net Cash increase/Decrease $ 551.6 603 $ 4732 49.5 $ 4370 24 $ 303.7 189) $360 (546) $ 1482 303 $ 1107 (9.5) Balance Sheet Data Total Assets $1,9228 $4.065.0 1.2727 1,5894 $4,110,7 1.2724 1,5712 $2.4820 7003 $2,4873 814.5 8666 $1.5259 5217 $1.1356 3942 5267 8745 7888 540.5 4758 Long-Term Debt Stockholders' Equity CEO Monetised Compensation (salary + other comp. in 5000 Adam Aron, CEO (1997-2007) Rob Katz, CEO (2007-present) Average Stock Price Per Share $1848.6 $ 6863 $7.995.0 $5,8286 $6.153.7 $5.3444 $2.999.4 $250 $185 $152 $109 $43 $24 $2350 Cash Dividend Per Share $5.05 $3.73 $2.87 $2.08 Via Anul 10K 2000- Vail Resorts (VR) case questions on internal strength/weakness Vail Resorts have three business lines: mountain ski, real estate, and lodging in several nations including the U.S., Canada, Australia, as well as Japan and Europe. Its current strategies include some level of diversification in both industries (diversified into related industries like lodging and real estate) and regions (both north and south hemisphere). Its current growth strategies include acquisitions and to a lesser extent, joint ventures or other forms of strategic alliance (e.g.EPIC marketing and reservation system). Questions: 1. Do a brief PESTEL analysis on the ski resort industry, pay special attention to the political, economic, natural environment, and regulation aspects in PESTEL----what challenges you see from those macro-environmental aspects? 2. What is your appraisal of VR's financial performance based on the data in case Exhibits 5-7? I would like you pay attention to its revenue growth, profitability ratios (ROS, ROA, ROE), debt/liquidity ratios (debt to assets and debt to shareholder's equity ratios), and trends in the recent years for the above numbers. What are your conclusions on VR's financial performance, based on the above ratios? 3. List the revenue, operating expenses, operating margins, numbers for three business lines (mountain, lodging, and real estate). Based on the above numbers, how do you evaluate the three business lines within VR----do you recommend investing more, or maybe withdrawl from any of the three industries? 4. What are some internal weaknesses and competitive liabilities either for VR's current situation or for the future? EXHIBIT 5 Destination Ski Resort Firms and On-Mountain Facilities 2017-2018 Season Summary of Resort Statistics Lift Ticket Vertical Price Skiable Drop Lift Capacity ($ U.S) Acreage (feet) #Of Lifts Of Trails (Skiers/Hour) Firm/Resort Location 7,300 3,200 41 185 83,022 8,171 5,280 38 200 67,307 5,289 3.450 31 193 59,069 3,527 29 97 Vail Resorts: Park City Utah $ 145 Whistler/Blackcomb British Columbia $156CN Vail Mountain Colorado $ 199 Heavenly Valley California $ 152 Breckenridge Colorado $ 169 Beaver Creek Colorado $ 199 Northstaro Tahoe California $ 152 Keystone Colorado $ 169 Kirkwood California $ 152 4.800 2,908 52,000 46,800 3,398 34 187 1,832 3,340 25 150 43.221 2,280 20 100 37,891 3,170 3,148 3.128 20 131 33,564 2,300 2,000 15 87 19,905 $ 1555,517 4,406 43 329 59,252 Aspen Ski (SKICO): Aspen 3/Snowmass Colorado Alterra Mountain Co: (Jt Vente SKICO/KSL) Squaw Valley/Alpine California Mammoth Mountain California Steamboat Springs Colorado Winter Park Colorado $ 169 2,850 42 270 6,000 3,500 73,595 42,100 $ 159 3.100 28 150 $ 160 3,668 16 165 2,965 3,081 $ 169 2,220 25 143 41,465 40,000 27,230 Mt. Tremblant Quebec $ 89CN 665 2,116 12 96 POWDR Corp: Copper Mountain Colorado 2,601 23 140 $ 150 2,490 $ 96 4,318 32,324 25,000 Mount Bachelor Oregon 3,365 11 101 Others: Sun Valley Telluride Idaho $ 149 2.154 3.400 18 121 29.717 Colorado 4,425 18 147 22,386 $ 135 $ 105 2,000 1.294 Taos New Mexico 2,612 13 110 15,000 KHIBIT 6 Most Visited Destination Ski Resorts (N. America) Annual Skier/ Snowboarder Visits, 2017-18 Season Annual Skier /Snow Boarder Visits, 2017-18 Season 2.5 2 Resort (owner) 2 SUO un 0.5 o WHISTLER (VR) PARKCTY (VR) VAIL MTN (VR) BREKNRDG (VR) MAMMOTH (ALTERRA) KEYSTONE (VR) BEAVER CRK (VR) WINTER PARK (ALTERRA) COPPER POWDR) HEAVENLY (VR) STEAMBOAT (ALTERRA) SOWVLY/ALP (ALTERRA) NRTHSTAR (VR) SNOMASS(SKICO) ASPEN 3 (SKICO) TELLURIDE (TG&S) SUNVLY (SINCLAIR) KIRKWOOD (VR) EXHIBIT 7 Trends in Selected Financial Data Val Resorts, Inc., 2000-2018 Fiscal Year Ended July 31: in milions except where indicated 2018 2017 2016 2015 2010 2005 2000 Statement of Operations: Revenue From Mountain From Lodging From Real Estate $1.1040 $1,7229 284.6 $1,6118 2785 254.6 $1,3046 2746 221 1.6013 $ 6385 1953 610 9948 $ 5409 195.4 72.8 $ 3738 1166 487 413 40 2011.6 16.9 1.0072 Total Revenue 1,400.0 810.1 531.1 1,0473 8815 777.1 4560 284.1 2514 246.4 2329 1929 3920 177.5 583 1036 1.1328 259.6 35 1,3960 $ 615.6 24.1 48 4 71.4 42.1 7203 Operating Expenses (end. D&A) For Mountain For Lodging For Real Estate Total Operating Expenses Net Operating income Gross Operating Margin For Mountain For Lodging For Real Estate 246 1.1525 $4488 627 8 298 B 1.3228 $ 5844 1,0584 $ 3416 $ 1745 $ 1823 $ 1013 34.2 28.5% 24.0% 8.8% 12.5% 380.0 35 ON 9.7 (426)% $ 2317 $ 144 324 10.3% (11376 $ 1498 $ 109 29.6% 8. (17.2% $ 1148 $ 124 12 (1701% $ 304 $ 130 275% 9.6% 19.9% $ 23.1 $ 80 11.11 13.6 $ 100 Net Income Annual Capital Expenditures (Operations $ 141 Cash Flows Net Cash From Operations Net Cash increase/Decrease $ 551.6 603 $ 4732 49.5 $ 4370 24 $ 303.7 189) $360 (546) $ 1482 303 $ 1107 (9.5) Balance Sheet Data Total Assets $1,9228 $4.065.0 1.2727 1,5894 $4,110,7 1.2724 1,5712 $2.4820 7003 $2,4873 814.5 8666 $1.5259 5217 $1.1356 3942 5267 8745 7888 540.5 4758 Long-Term Debt Stockholders' Equity CEO Monetised Compensation (salary + other comp. in 5000 Adam Aron, CEO (1997-2007) Rob Katz, CEO (2007-present) Average Stock Price Per Share $1848.6 $ 6863 $7.995.0 $5,8286 $6.153.7 $5.3444 $2.999.4 $250 $185 $152 $109 $43 $24 $2350 Cash Dividend Per Share $5.05 $3.73 $2.87 $2.08 Via Anul 10K 2000