Answered step by step
Verified Expert Solution
Question
1 Approved Answer
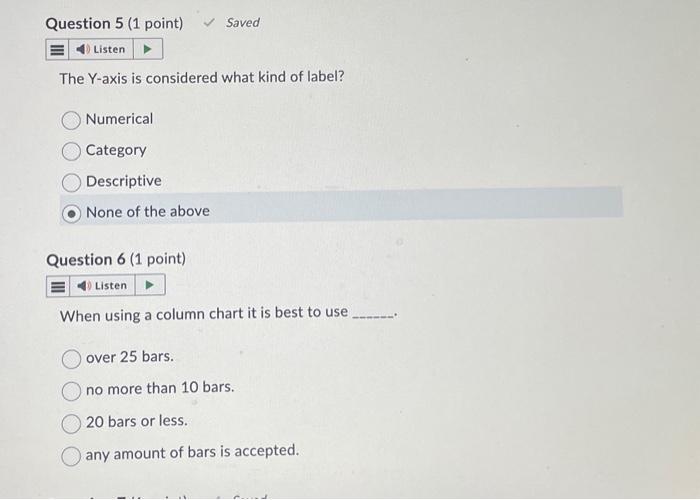
please anwser the question. thanks The Y-axis is considered what kind of label? Numerical Category Descriptive None of the above Question 6 (1 point) When
please anwser the question. thanks 


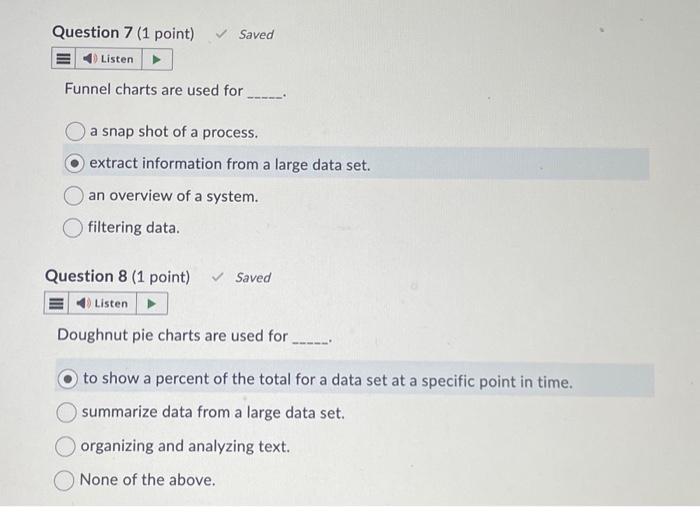
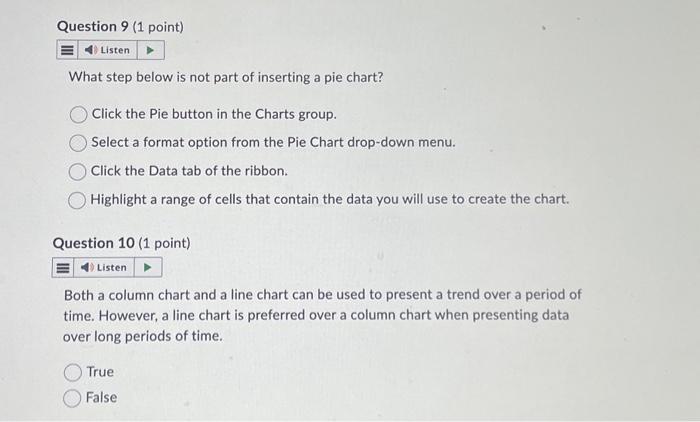
The Y-axis is considered what kind of label? Numerical Category Descriptive None of the above Question 6 (1 point) When using a column chart it is best to use over 25 bars. no more than 10 bars. 20 bars or less. any amount of bars is accepted. Funnel charts are used for a snap shot of a process. extract information from a large data set. an overview of a system. filtering data. Question 8 (1 point) Saved Doughnut pie charts are used for to show a percent of the total for a data set at a specific point in time. summarize data from a large data set. organizing and analyzing text. None of the above. What step below is not part of inserting a pie chart? Click the Pie button in the Charts group. Select a format option from the Pie Chart drop-down menu. Click the Data tab of the ribbon. Highlight a range of cells that contain the data you will use to create the chart. Question 10 (1 point) Both a column chart and a line chart can be used to present a trend over a period of time. However, a line chart is preferred over a column chart when presenting data over long periods of time. True False 


Step by Step Solution
There are 3 Steps involved in it
Step: 1

Get Instant Access to Expert-Tailored Solutions
See step-by-step solutions with expert insights and AI powered tools for academic success
Step: 2

Step: 3

Ace Your Homework with AI
Get the answers you need in no time with our AI-driven, step-by-step assistance
Get Started


