 Please assist in completing the Trading Multiples section
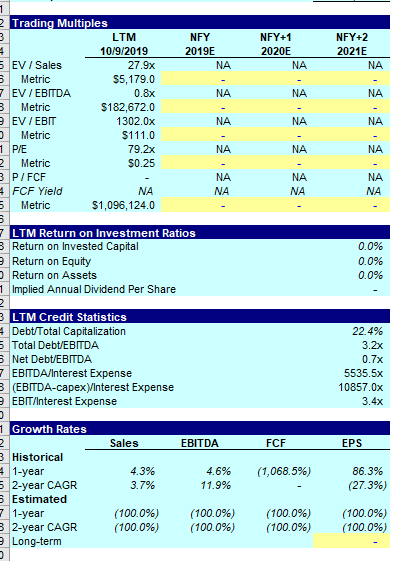
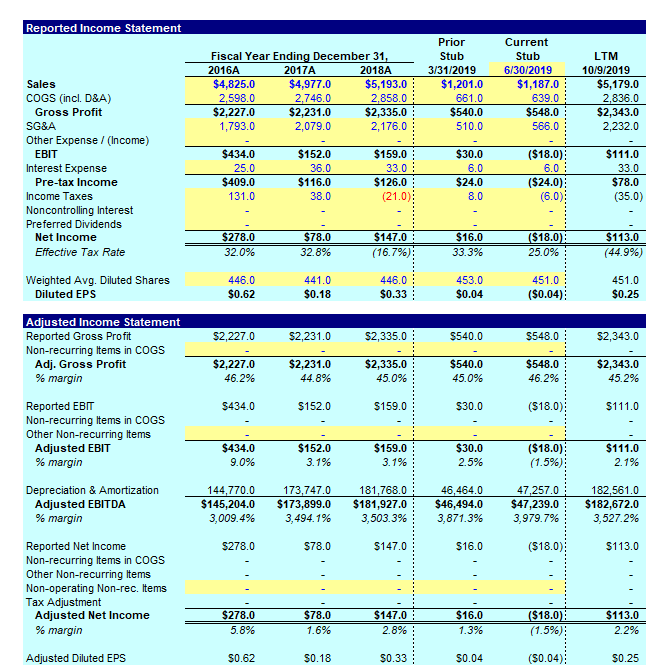
Reported Income Statement Prior Current Stub 3/31/2019 Fiscal Year Ending December 31, 2016A Stub LTM 2017A 2018A 6/30/2019 10/9/2019 Sales $4,825.0 2,598.0 $2,227.0 1,793.0 $4,977.0 2,746.0 $2,231.0 2,079.0 $5,193.0 $1,201.0 $1,187.0 $5,179.0 2,836.0 $2,343.0 2,232.0 COGS (incl. D&A) 2,858.0 661.0 639.0 $2,335.0 2,176.0 $540.0 $548.0 566.0 Gross Profit SG&A 510.0 Other Expense /(Income) EBIT Interest Expense ($18.0) $434.0 $152.0 $159.0 33.0 $30.0 $111.0 25.0 36.0 6.0 6.0 33.0 ($24.0) (6.0) $409.0 $116.0 $126.0 (21.0) $24.0 8.0 $78.0 (35.0) Pre-tax Income Income Taxes 131.0 38.0 Noncontrolling Interest Preferred Dividends $16.0 33.3% $278.0 $78.0 $147.0 ($18.0) $113.0 Net Income (16.7 %) Effective Tax Rate 32.0% 32.8% 25.0% (44.9%) 446,0 $0.33 451.0 ($0.04) Weighted Avg. Diluted Shares 446.0 441.0 453.0 451.0 $0.62 $0.18 $0.04 $0.25 Diluted EPS Adjusted Income Statement Reported Gross Profit Non-recurring Items in COGS Adj. Gross Profit % margin S2,335.0 S2,227.0 $2,231.0 S540.0 $548.0 S2,343.0 $2,227.0 $2,231.0 44.8% $2,335.0 $540.0 $548.0 46.2% $2,343.0 46.2% 45.0% 45.0% 45.2% Reported EBIT Non-recurring Items in COGS Other Non-recurring Items Adjusted EBIT % margin $434.0 $152.0 S159.0 $30.0 (S18.0) S111.0 ($18.0) (1.5%) $434.0 $152.0 $159.0 $30.0 2.5% $111.0 9.0% 3.1% 3.1% 2.1% Depreciation & Amortization Adjusted EBITDA % margin 173,747.0 $173,899.0 3,494.1% 144,770.0 181,768.0 $181,927.0 3,503.3% 46,464.0 $46,494.0 3,871.3% 47,257.0 182,561.0 $182,672.0 3,527.2 % $145,204.0 3,009.4 % $47,239.0 3,979.7 % Reported Net Income Non-recurring Items in COGS Other Non-recurring Items Non-operating Non-rec. Items Tax Adjustment Adjusted Net Income % margin $78.0 $278.0 $147.0 $16.0 (S18.0) $113.0 ($18.0): (1.5%) $278.0 $78.0 $147.0 $16.0 $113.0 1.6% 1.3% 5.8% 2.8% 2.2% (S0.04) Adjusted Diluted EPS SO0.62 $0.18 S0.33 $0.04 $0.25 2 Trading Multiples NFY+1 LTM NFY NFY+2 4 2021E 10/9/2019 2019E 2020E 5EV/Sales 27,9x NA NA NA Metric $5,179.0 NA 7EVIEBITDA 0.8x NA NA Metric S182,672.0 EV/EBIT Metric 1 P/E 1302.0x NA NA NA $111.0 79.2x $0.25 NA NA NA Metric 3P/FCF 4FCF Yield NA NA NA - NA NA NA NA Metric S1,096,124.0 7 LTM Return on Investment Ratios BReturn on Invested Capital 9Return on Equity Return on Assets 1 Implied Annual Dividend Per Share 0.0% 0.0% 0.0% 2 3LTM Credit Statistics Debt/Total Capitalization 5Total Debt/EBITDA 22.4% 3.2x 6 Net Debt/EBITDA 0.7x 7EBITDA/Interest Expense 8(EBITDA-capex)VInterest Expense 9EBIT/Interest Expense 5535.5x 10857.0x 3.4x 1 Growth Rates EPS Sales EBITDA FCF 3Historical 41-year 2-year CAGR 4.6% 4.3% (1,068.5%) 86.3% 3.7% 11.9% (27.3%) 6 Estimated 71-year B2-year CAGR Long-term (100.0%) (100.0%) (100.0%) (100.0%) (100.0%) (100.0%) (100.0%) (100.0%)