

Answered step by step
Verified Expert Solution
Question
1 Approved Answer
Please be thorough so I can actually complete the problem. And please include equations In this analysis, you will be generating multiple sales forecasts based
Please be thorough so I can actually complete the problem. And please include equations 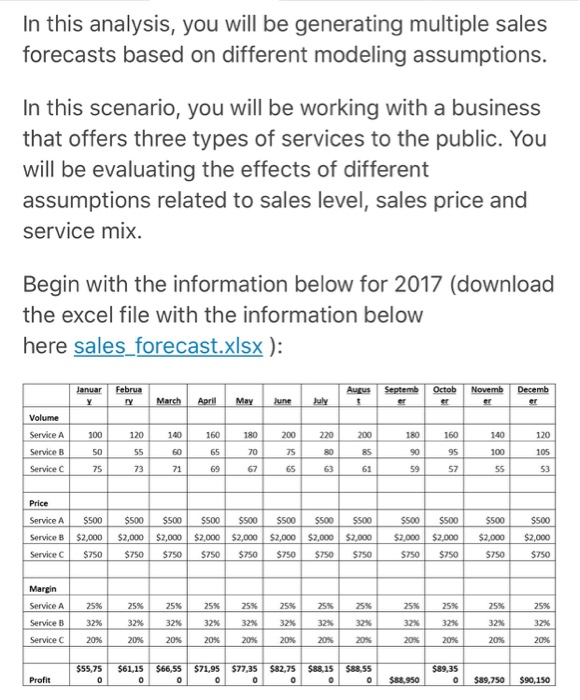
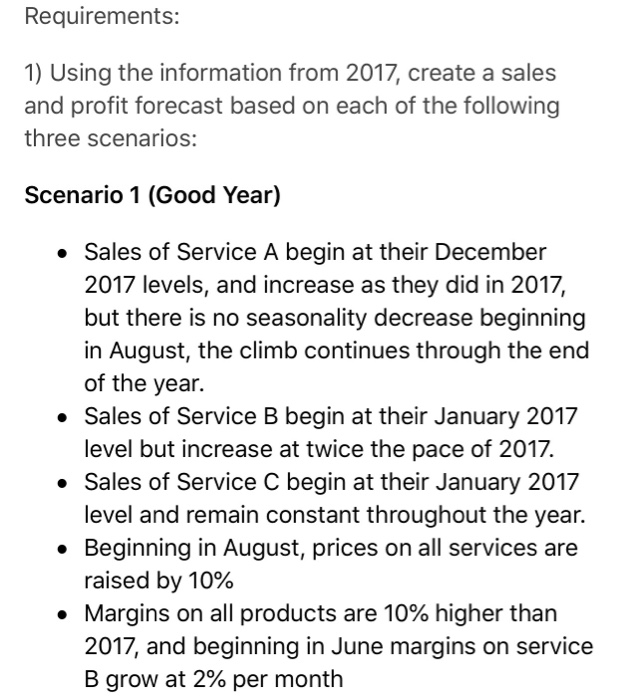
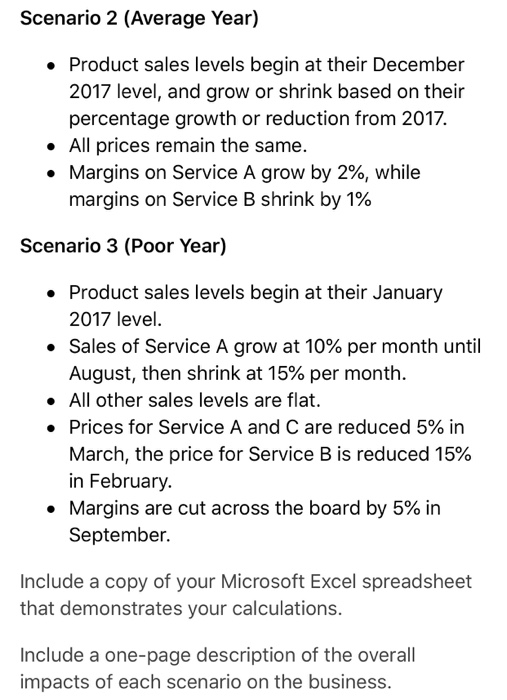
In this analysis, you will be generating multiple sales forecasts based on different modeling assumptions. In this scenario, you will be working with a business that offers three types of services to the public. You will be evaluating the effects of different assumptions related to sales level, sales price and service mix Begin with the information below for 2017 (download the excel file with the information below here sales forecast.xlsx) Januar Februa Aurus Septemb Octob Novemb Decemb March April 100 Service A Service B 120 14016018020220200 180 160 120 75 Service C 75 73 71 65 Service A Service B $2,000$2,000 $2,000 $2,000 $2,000 $2,000 $2,000 $2,000 $2,000 $2,000 $2,000 $2,000 ServiceC| $750| $750| $750| S750| $750| $750| S750| S750 $500 500 $500$500 $500 5500 $500 $750 $750750$750 25%| 32%| 20% | 25%| 32%| 20% | 2s%| 32% | 20% | 25%| Service A Service bB Service C 20 25%| 32%| 20% | 25%| 32%| 20% | 25%| 32%! 20% 25% 32% 20% 25% 25 | 32% 20% | 2016 20% 20% 555,75 $61,15 $66,5571,9$77,35$82,75$88,15$88.55 0 $88,950 0 $89,750 $90,150 Requirements: 1) Using the information from 2017, create a sales and profit forecast based on each of the following three scenarios: Scenario 1 (Good Year) Sales of Service A begin at their December 2017 levels, and increase as they did in 2017, but there is no seasonality decrease beginning in August, the climb continues through the end of the year. Sales of Service B begin at their January 2017 level but increase at twice the pace of 2017. Sales of Service C begin at their January 2017 level and remain constant throughout the year. Beginning in August, prices on all services are raised by 10% Margins on all products are 10% higher than 2017, and beginning in June margins on service B grow at 2% per month Scenario 2 (Average Year) . Product sales levels begin at their December 2017 level, and grow or shrink based on their percentage growth or reduction from 2017. All prices remain the same. Margins on Service A grow by 2%, while margins on Service B shrink by 1% Scenario 3 (Poor Year) Product sales levels begin at their January 2017 level Sales of Service A grow at 10% per month until August, then shrink at 15% per month. . . All other sales levels are flat. Prices for Service A and C are reduced 5% in March, the price for Service B is reduced 15% in February Margins are cut across the board by 5% in September. Include a copy of your Microsoft Excel spreadsheet that demonstrates your calculations. Include a one-page description of the overall impacts of each scenario on the business Step by Step Solution
There are 3 Steps involved in it
Step: 1

Get Instant Access to Expert-Tailored Solutions
See step-by-step solutions with expert insights and AI powered tools for academic success
Step: 2

Step: 3
Ace Your Homework with AI
Get the answers you need in no time with our AI-driven, step-by-step assistance
Get Started
Financial Accounting A Practical Version
Authors: Abanis Turyahebwa ,Kasozi Geoffrey
1st Edition
6205489481, 978-6205489482