

Answered step by step
Verified Expert Solution
Question
1 Approved Answer
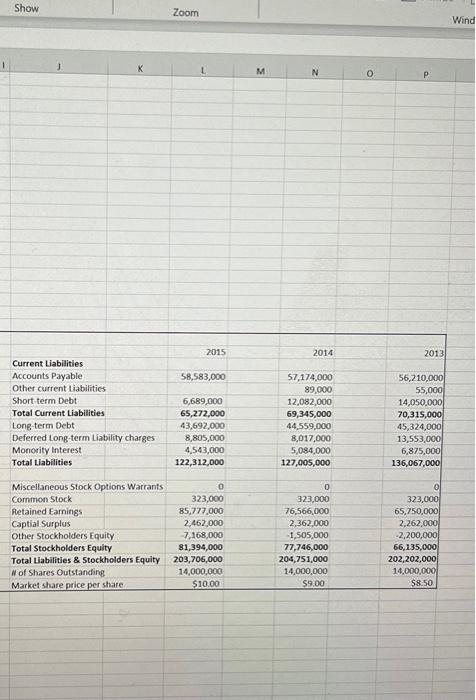
please calculate a/r turnover, total asset turnover, average collection period, debt ratio, and debt equity for years 2013, 2014, and 2015. please show work (:
please calculate a/r turnover, total asset turnover, average collection period, debt ratio, and debt equity for years 2013, 2014, and 2015. please show work (: 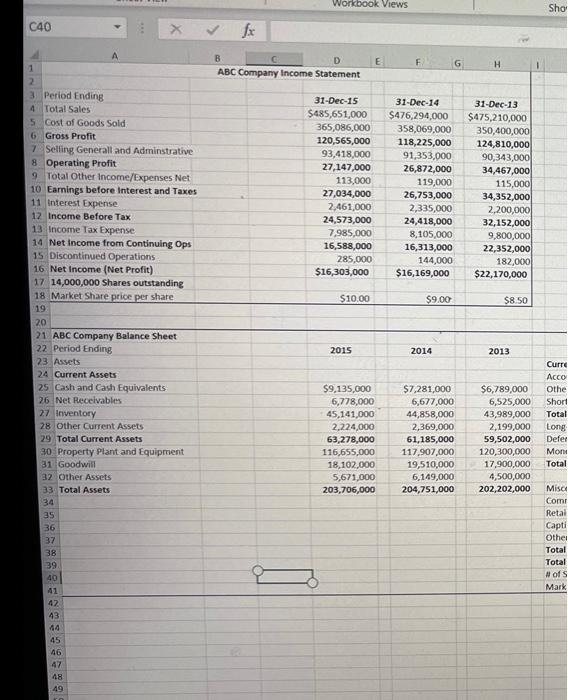
C40 1 2 3 Period Ending 4 Total Sales 5 Cost of Goods Sold, 6 Gross Profit 7 Selling Generall and Adminstrative 8 Operating Profit 9 Total Other Income/Expenses Net 10 Earnings before Interest and Taxes 11 Interest Expense 12 Income Before Tax 13 Income Tax Expense 14 Net Income from Continuing Ops 15 Discontinued Operations 16 Net Income (Net Profit) 17 14,000,000 Shares outstanding 18 Market Share price per share 19 20 21 ABC Company Balance Sheet 22 Period Ending 23 Assets 24 Current Assets 25 Cash and Cash Equivalents 26 Net Receivables 27 Inventory 28 Other Current Assets 29 Total Current Assets 30 Property Plant and Equipment 31 Goodwill 32 Other Assets 33 Total Assets 34 35 36 37 38 39 40 41 42 43 44 45 46 47 48 49 fx Workbook Views B ABC Company Income Statement $10.00 E 365,086,000 358,069,000 120,565,000 118,225,000 93,418,000 27,147,000 113,000 27,034,000 2,461,000 24,573,000 7,985,000 16,588,000 285,000 $16,303,000 2015 31-Dec-15 31-Dec-14 31-Dec-13 $485,651,000 $476,294,000 $475,210,000 350,400,000 124,810,000 90,343,000 34,467,000 115,000 34,352,000 2,200,000 32,152,000 9,800,000 22,352,000 182,000 $22,170,000 $9,135,000 6,778,000 45,141,000 F 2,224,000 63,278,000 116,655,000 18,102,000 5,671,000 203,706,000 91,353,000 26,872,000 119,000 26,753,000 2,335,000 24,418,000 8,105,000 16,313,000 144,000 $16,169,000 $9.00 G 2014 H $8.50 2013 Sho Curre Acco $6,789,000 Othe 6,525,000 Short 43,989,000 Total $7,281,000 6,677,000 44,858,000 2,369,000 2,199,000 Long 61,185,000 59,502,000 Defer 117,907,000 120,300,000 Moni 19,510,000 17,900,000 Total 6,149,000 4,500,000 204,751,000 202,202,000 Misce Comm Retai Capti Other Total Total # of S Mark Show Current Liabilities Accounts Payable Other current Liabilities. Short-term Debt Total Current Liabilities Long-term Debt Deferred Long-term Liability charges Monority Interest Total Liabilities Zoom 2015 58,583,000 6,689,000 65,272,000 43,692,000 8,805,000 4,543,000 122,312,000 Miscellaneous Stock Options Warrants Common Stock Retained Earnings Captial Surplus Other Stockholders Equity -7,168,000 Total Stockholders Equity 81,394,000 Total Liabilities & Stockholders Equity 203,706,000 # of Shares Outstanding 14,000,000 $10.00 Market share price per share 0 323,000 85,777,000 2,462,000 M N 2014 57,174,000 89,000 12,082,000 69,345,000 44,559,000 8,017,000 5,084,000 127,005,000 0 323,000 76,566,000 2,362,000 1,505,000 77,746,000 204,751,000 14,000,000 $9.00 O P 2013 56,210,000 55,000 14,050,000 70,315,000 45,324,000 13,553,000 6,875,000 136,067,000 0 323,000 65,750,000 2,262,000 -2,200,000 66,135,000 202,202,000 14,000,000 $8.50 Wind Step by Step Solution
There are 3 Steps involved in it
Step: 1

Get Instant Access to Expert-Tailored Solutions
See step-by-step solutions with expert insights and AI powered tools for academic success
Step: 2

Step: 3
Ace Your Homework with AI
Get the answers you need in no time with our AI-driven, step-by-step assistance
Get Started
Handbook Of Global Financial Markets
Authors: Sabri Boubaker, Duc Khuong Nguyen
1st Edition
9813236647, 978-9813236646