 Please calculate free cash flow for Columbia and VF
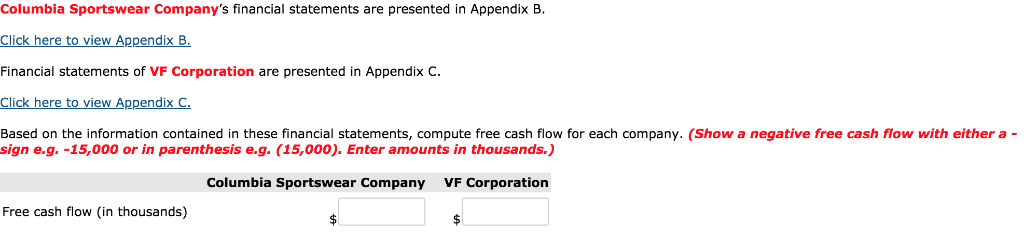
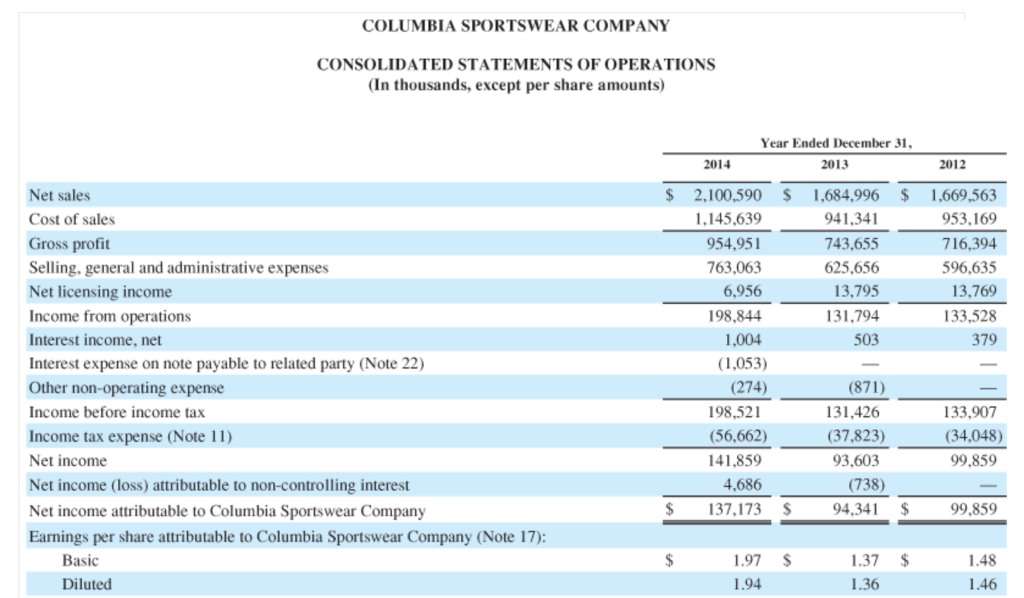
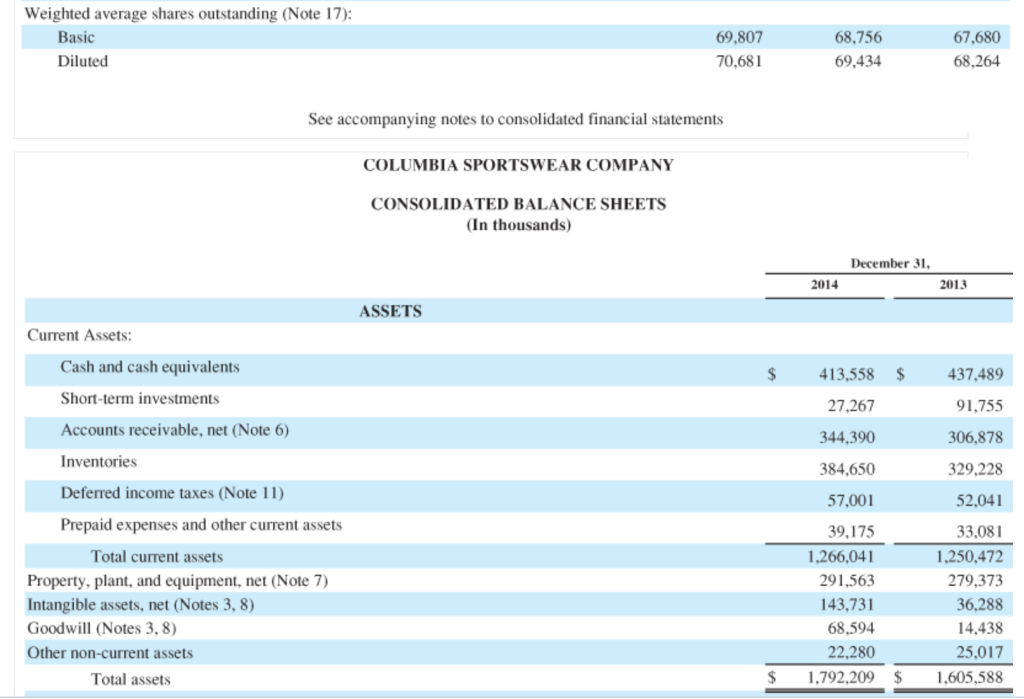
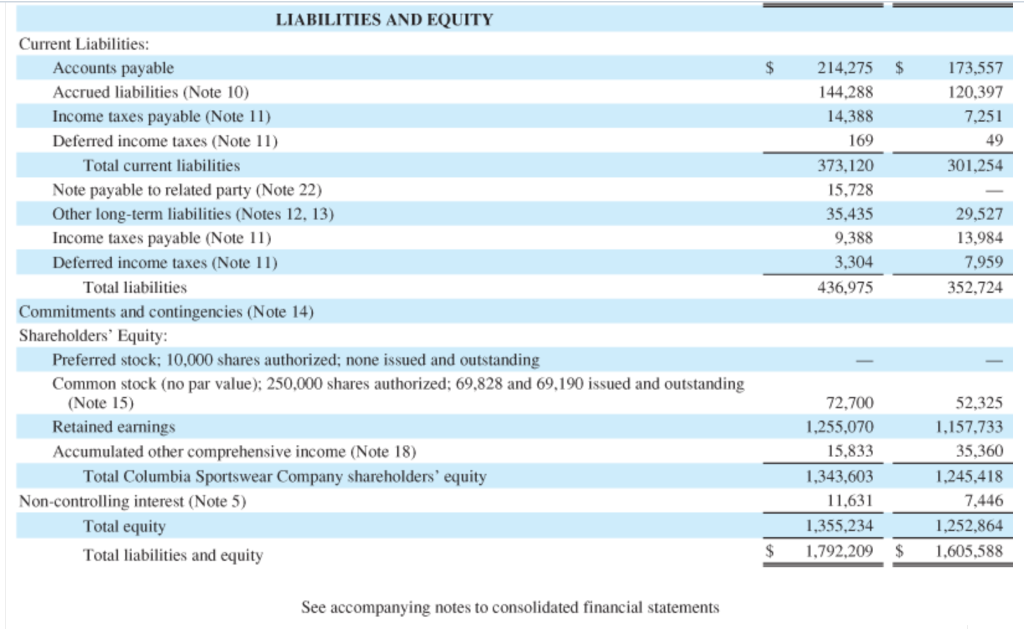
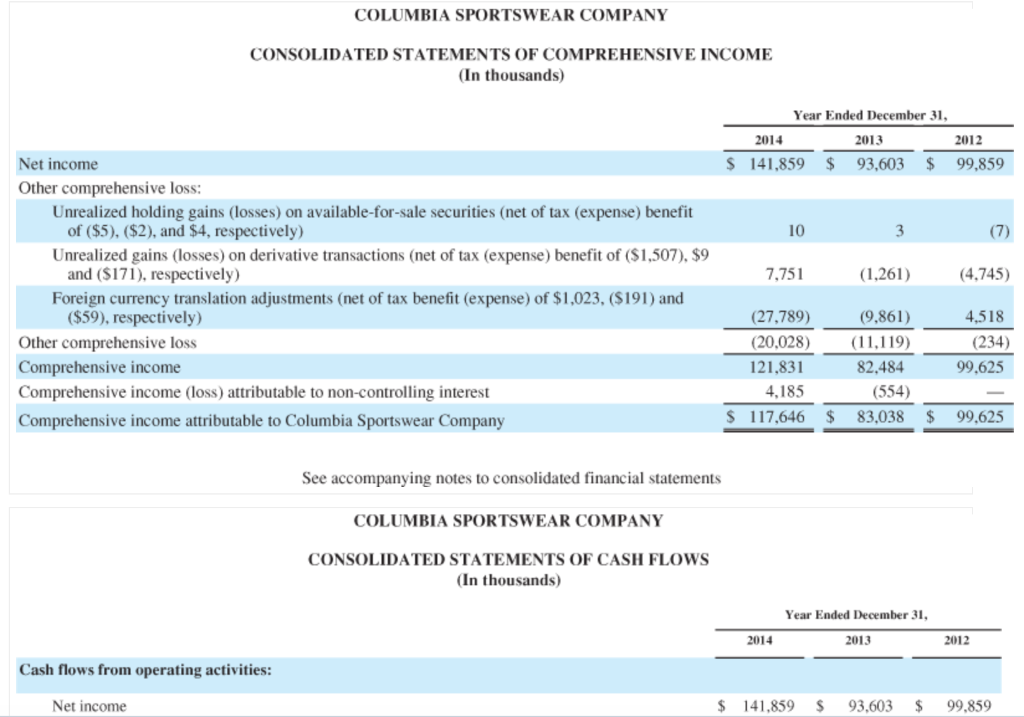
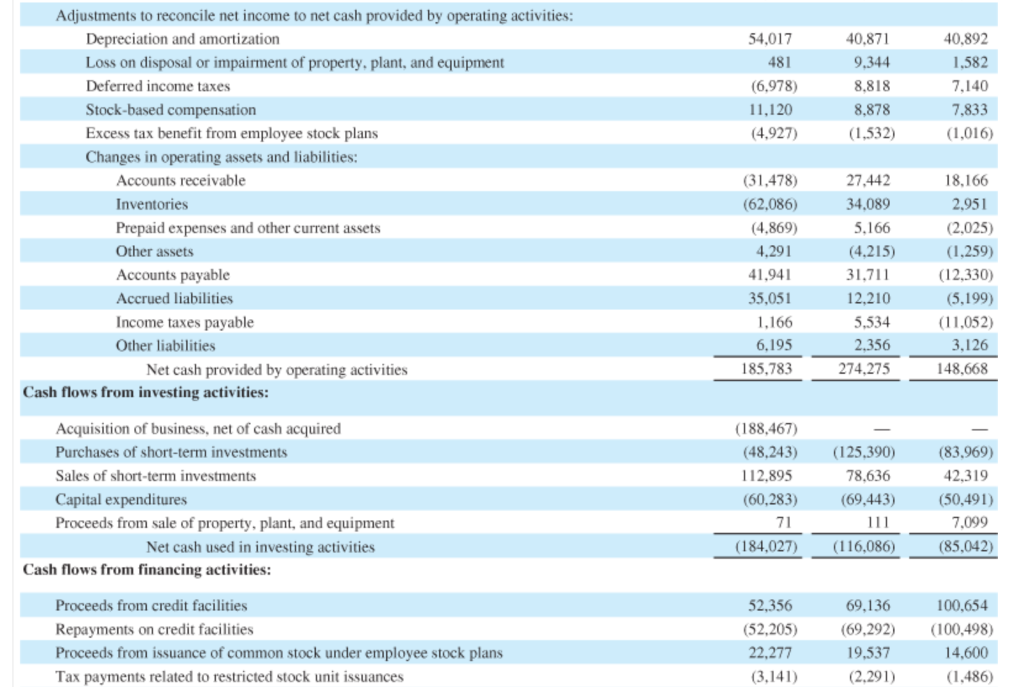
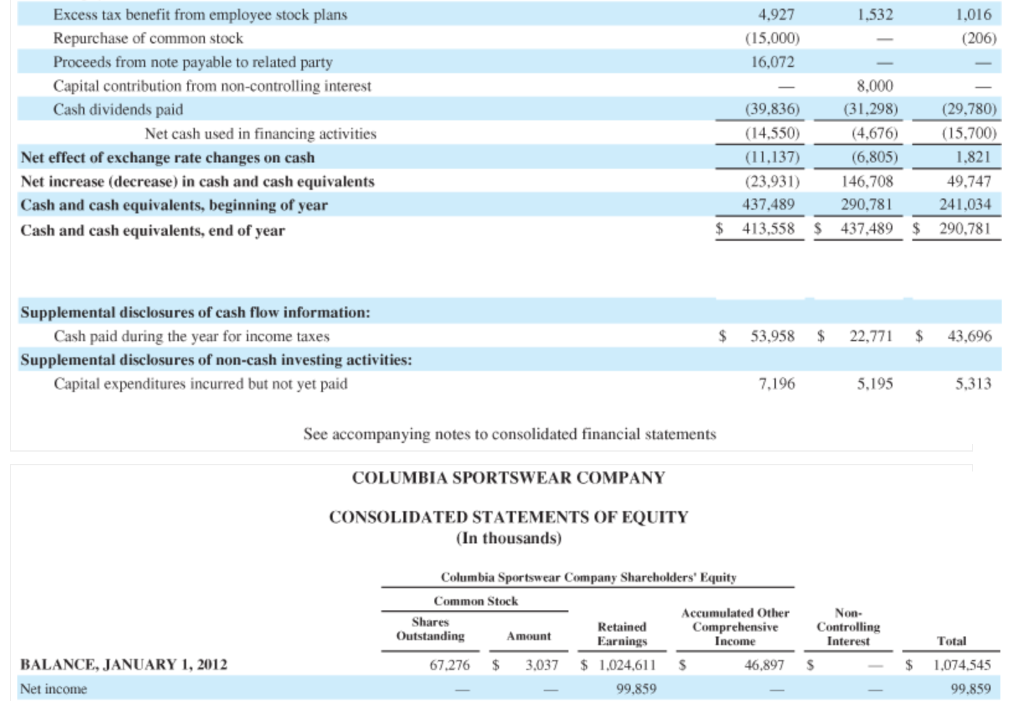
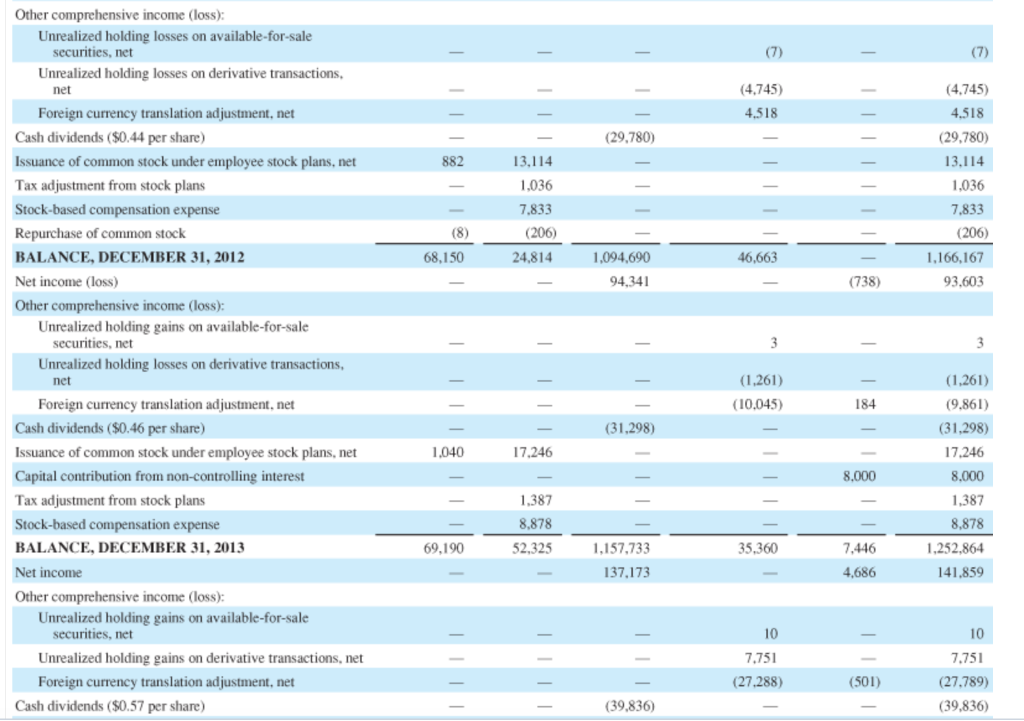
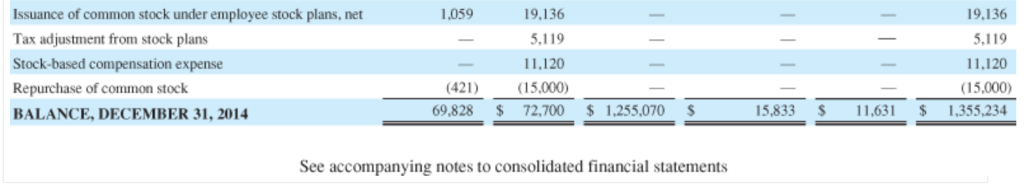
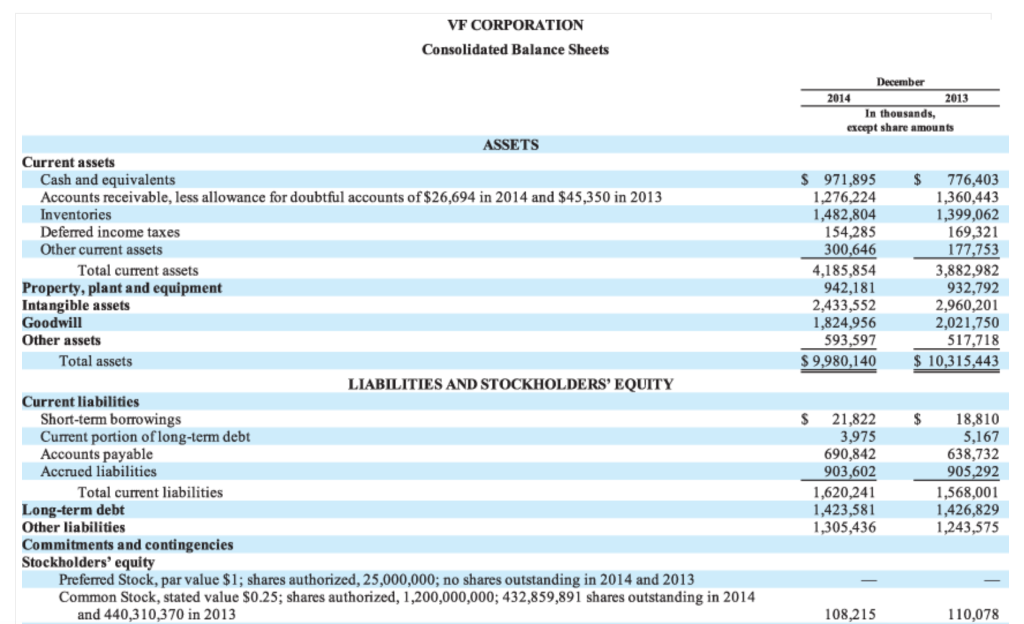
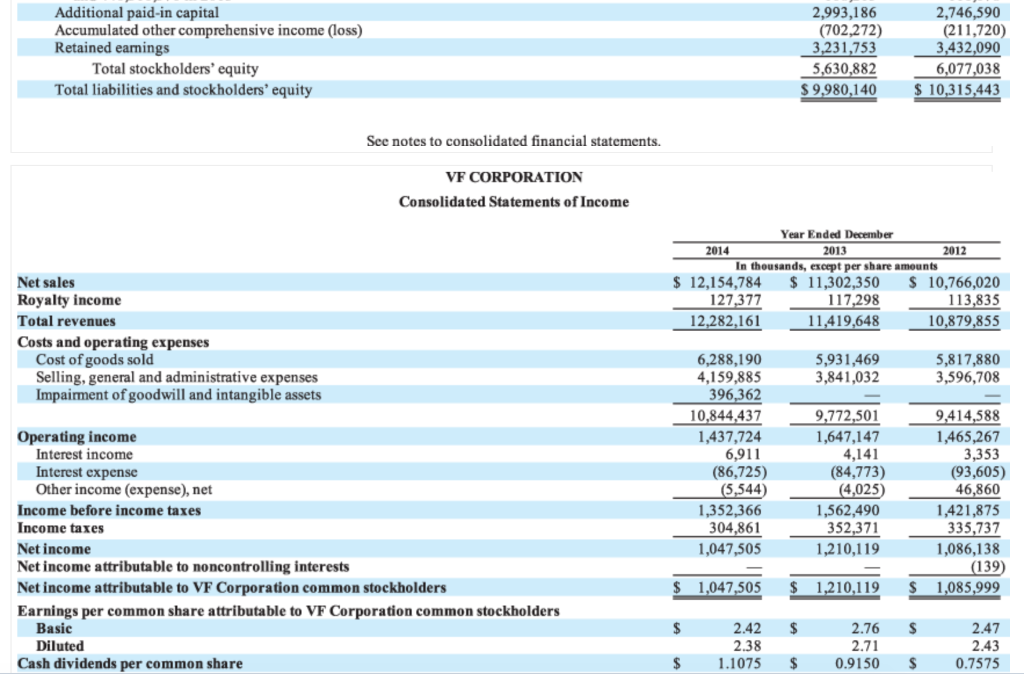
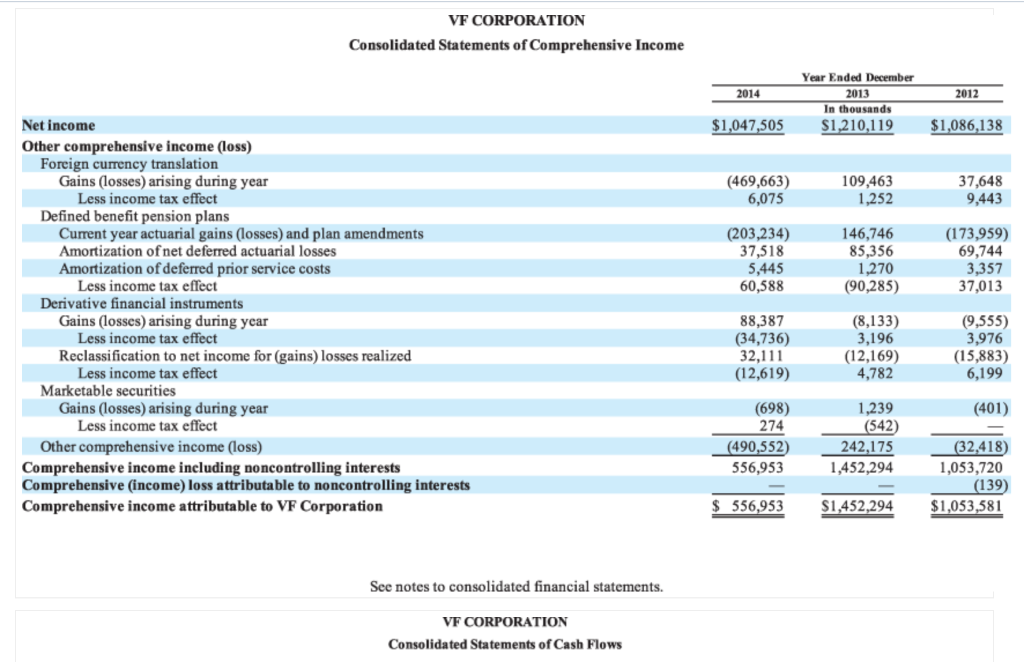
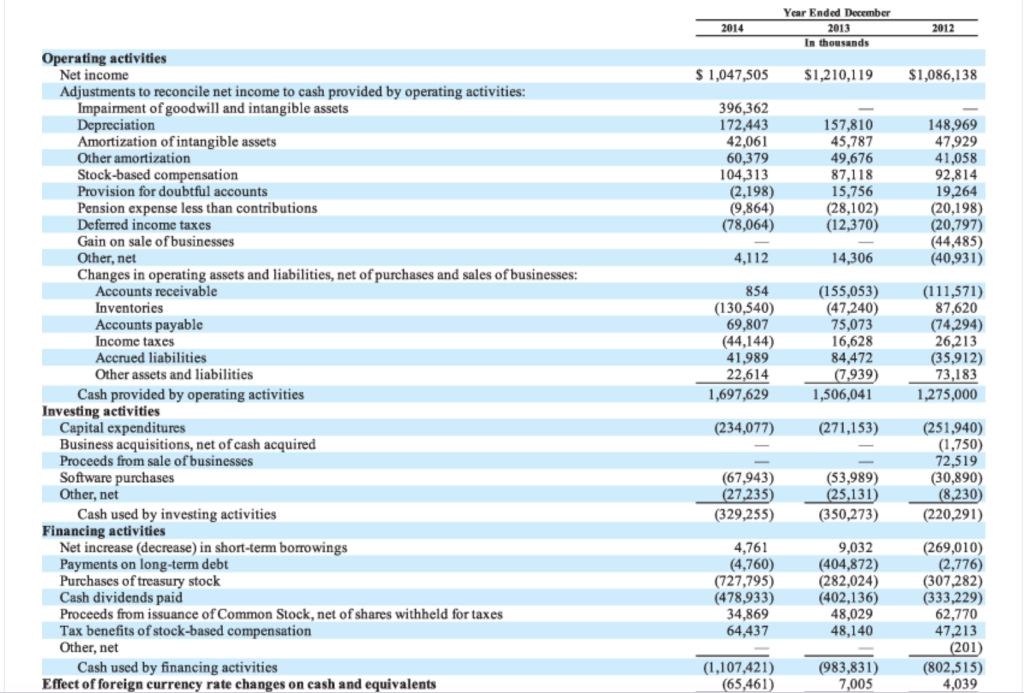
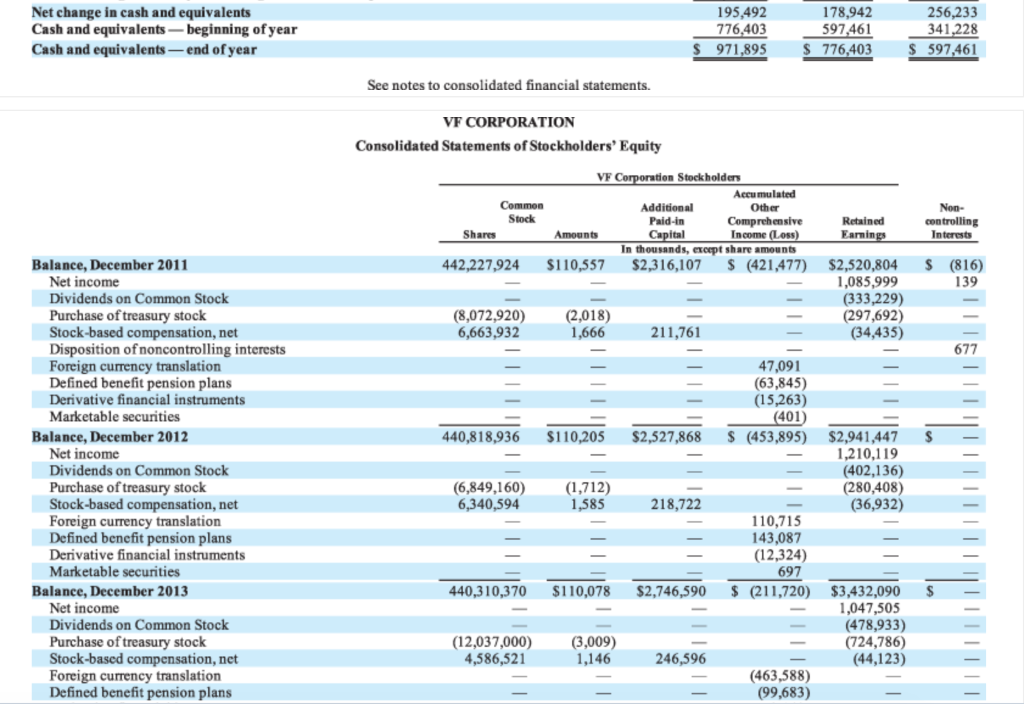
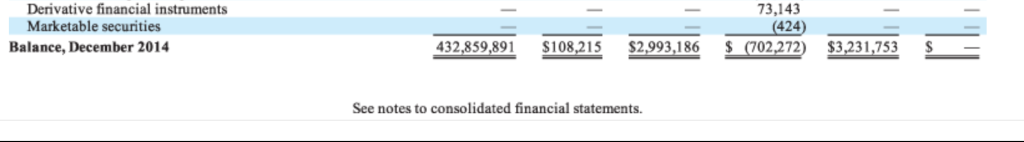
Columbia Sportswear Company's financial statements are presented in Appendix B Click here to view Appendix B. Financial statements of VF Corporation are presented in Appendix C. Click here to view Appendix C Based on the information contained in these financial statements, compute free cash flow for each company. (Show a negative free cash flow with either a sign e.g. -15,000 or in parenthesis e.g. (15,000). Enter amounts in thousands.) Columbia Sportswear Company VF Corporation Free cash flow (in thousands) COLUMBIA SPORTSWEAR COMPANY CONSOLIDATED STATEMENTS OF OPERATIONS In thousands, except per share amounts) Year Ended December 31 2014 2013 2012 Net sales Cost of sales Gross profft Selling, general and administrative expenses Net licensing income Income from operations Interest income, net Interest expense on note payable to related party (Note 22) Other non-operating expense Income before income tax Income tax expense (Note 11) Net income Net income (loss) attributable to non-controlling interest Net income attributable to Columbia Sportswear Company Earnings per share attributable to Columbia Sportswear Company (Note 17) $ 2,100,590 S 1,684,996 1,669,563 953,169 716,394 5%,635 13.769 133,528 379 1,145,639 954,951 763,063 6,956 198,844 1,004 (1,053) (274) 198,521 941,341 743,655 625,656 13,795 131,794 503 (871) 131,426 (37,823) 93.603 (738) 133,907 (34,048) 99.859 (56,662) 141,859 4.686 $ 137.173 $ 94,341 99.859 Basic Diluted 1.37 $ 1.36 1.48 1.97 S 1.94 1.46 Weighted average shares outstanding (Note 17) 69,807 70,681 67.680 68,264 Basic Diluted 68,756 69,434 See accompanying notes to consolidated financial statements COLUMBIA SPORTSWEAR COMPANY CONSOLIDATED BALANCE SHEETS (In thousands) December 31 2013 2014 ASSETS Current Assets: Cash and cash equivalents Short-term investments Accounts receivable, net (Note 6) Inventories Deferred income taxes (Note 11) Prepaid expenses and other current assets 413,558$ 437.489 91,755 306,878 329,228 52,041 33,081 1 .250.472 279,373 36,288 4.438 25,017 $1.792.209 1.605.588 27,267 344.390 384,650 57,001 39,175 1,266,041 291,563 143,731 68.594 22,280 Total current assets Property, plant, and equipment, net (Note 7) Intangible assets, net (Notes 3, 8) Goodwill (Notes 3, 8) Other non-current assets Total assets LIABILITIES AND EQUITY Current Liabilities: s 214.275 173,557 120,397 7,251 49 301,254 Accounts payable Accrued liabilities (Note 10) Income taxes payable (Note 11) Deferred income taxes (Note 11) 44,288 14.388 169 373.120 15,728 35,435 9,388 3,304 436,975 Total current liabilities Note payable to related party (Note 22) Other long-term liabilities (Notes 12, 13) Income taxes payable (Note 11) Deferred income taxes (Note 11) 29,527 13,984 7.959 352,724 Total liabilities Commitments and contingencies (Note 14) Shareholders' Equity: Preferred stock; 10,000 shares authorized; none issued and outstanding Common stock (no par value); 250,000 shares authorized; 69,828 and 69,190 issued and outstanding 52,325 1,157,733 35,360 1,245,418 7.446 1,252.864 $ 1.792,209 1,605,588 72,700 1,255,070 15,833 1,343,603 11.631 1,355,234 (Note 15) Retained earnings Accumulated other comprehensive income (Note 18) Total Columbia Sportswear Company shareholders' equity Non-controlling interest (Note 5) Total equity Total liabilities and equity See accompanying notes to consolidated financial statements COLUMBIA SPORTSWEAR COMPANY CONSOLIDATED STATEMENTS OF COMPREHENSIVE INCOME (In thousands) Year Ended December 31 2013 $ 141,859 93,603 $ 99,859 2012 2014 Net income r comprehensive loss: Unrealized holding gains (losses) on available-for-sale securities (net of tax (expense) benefit of (S5), ($2), and $4, respectively) Unrealized gains (losses) on derivative transactions (net of tax (expense) benefit of ($1,507), $9 10 7.751 (1,261) and (S171), respectively) (4.745) Foreign currency translation adjustments (net of tax benefit (expense) of $1,023, ($191) and 9.861) ($59), respectively) (27.789) (20,028) 121,831 4.185 4.518 (234) 99.625 Other comprehensive loss Comprehensive income Comprehensive income (loss) attributable to non-controlling interest Comprehensive income attributable to Columbia Sportswear Company 82.484 554)- S 117.646 83,038$ 99.625 See accompanying notes to consolidated financial statements COLUMBIA SPORTSWEAR COMPANY CONSOLIDATED STATEMENTS OF CASH FLOWS In thousands) Year Ended December 31 2014 2013 2012 Cash flows from operating activities: Net income $ 141,859 93,603 99.859 Adjustments to reconcile net income to net cash provided by operating activities: 40.871 9,344 8.818 8.878 (1,532) 40.892 1,582 7,140 7.833 (1,016) Depreciation and amortization Loss on disposal or impairment of property, plant, and equipment Deferred income taxes Stock-based compensation Excess tax benefit from employee stock plans Changes in operating assets and liabilities: 54.017 481 (6,978) 11,120 4,927) (31,478) (62,086) (4,869) 4.291 1,941 35,051 1,166 6.195 185.783 27.442 34,089 5.166 (4.215) 31.711 12,210 5,534 2.356 274.275 18.166 2.951 (2.025) (1,259) (12,330) (5,199) (11,052) 3.126 148.668 Accounts receivable Inventories Prepaid expenses and other current assets Other assets Accounts payable Accrued liabilities Income taxes payable Other liabilities Net cash provided by operating activities Cash flows from investing activities: Acquisition of business, net of cash acquired Purchases of short-term investments Sales of short-term investments Capital expenditures Proceeds from sale of property, plant, and equipment (188,467) (48,243) (125,390) 112,895 (60,283) (83,969) 42.319 (50,491) 7.099 (85.042) 78.636 (69,443) (184,027) (116,086) Net cash used in investing activities Cash flows from financing activities: 52,356 (52,205) 22,277 (3,141) 100,654 69,292) 100,498) 14.600 (1,486) 69.136 Proceeds from credit facilities Repayments on credit facilities Proceeds from issuance of common stock under employee stock plans Tax payments related to restricted stock unit issuances 19,537 (2.291) 4.927 (15,000) 16,072 1,532 Excess tax benefit from employee stock plans Repurchase of common stock Proceeds from note payable to related party Capital contribution from non-controlling interest Cash dividends paid 1.016 206) 8,000 (31.298) (4.676) (6,805) 146,708 (29,780) (15.700) 1,821 49.747 290.781 241.034 413.558 437.489 290,781 (39,836) (14,550) (11,137) (23,931) 437.489 Net cash used in financing activities Net effect of exchange rate changes on cash Net increase (decrease) in cash and cash equivalents Cash and cash equivalents, beginning of year Cash and cash equivalents, end of year Supplemental disclosures of cash flow information: Cash paid during the year for income taxes S53.958 22.77143,696 Supplemental disclosures of non-cash investing activities: Capital expenditures incurred but not yet paid 7,196 5,195 5,313 See accompanying notes to consolidated financial statements COLUMBIA SPORTSWEAR COMPANY CONSOLIDATED STATEMENTS OF EQUITY (In thousands) Columbia Sportswear Company Shareholders' Equity Common Stock Accumulated Other Comprehensive Income Shares Outstanding Retained Earnings Controlling Interest A mount Total BALANCE JANUARY 1, 2012 Net income 67.276 3.037 $ 1,024.611 S S 1,074,545 99,859 46.897S 99,859 Other comprehensive income (loss): Unrealized holding losses on available-for-sale securities, net Unrealized holding losses on derivative transactions (4,745) 4.518 (29,780) 13.114 1,036 7,833 (206) 1,166,167 93.603 (4.745) net Foreign currency translation adjustment, net Cash dividends ($0.44 per share) Issuance of common stock under employee stock plans, net Tax adjustment from stock plans Stock-based compensation expense Repurchase of common stock BALANCE, DECEMBER 31, 2012 Net income (loss) Other comprehensive income (loss): 4.518 (29,780) 13.114 1036 7,833 (206) 24,814 882 1,094,690 94,341 68,150 46,663 (738) Unrealized holding gains on available-for-sale securities, net Unrealized holding losses on derivative transactions, (1,261) (10,045) (1,261) 9.861) (31,298) 17.246 8,000 1,387 8,878 1,252,864 141,859 net Foreign currency translation adjustment, net Cash dividends ($0.46 per share) Issuance of common stock under employee stock plans, net Capital contribution from non-controlling interest Tax adjustment from stock plans Stock-based compensation expense BALANCE DECEMBER 31, 2013 Net incomme Other comprehensive income (loss): 184 (31,298) 1,040 17.246 8,000 1,387 8,878 52,325 69,190 1,157,733 7.446 35,360 137,173 4,686 Unrealized holding gains on available-for-sale 10 7.751 (27,288) 10 7.751 (27.789) (39,836) securities, net Unrealized holding gains on derivative transactions, net Foreign currency translation adjustment, net (501) Cash dividends ($0.57 per share) (39,836) 19,136 ,119 11,120 9,136 5,119 11.120 (15,000) Issuance of common stock under employee stock plans, net Tax adjustment from stock plans Stock-based compensation expense Repurchase of common stock BALANCE, DECEMBER 31, 2014 1,059 421) (15,000) 69,828 72.700 S1.255.070 15,833 11,631 $ 1,355,234 See accompanying notes to consolidated financial statements VF CORPORATION Consolidated Balance Sheets December 2014 2013 In thousands, except share amounts ASSETS Current assets Cash and equivalents Accounts receivable, less allowance for doubtful accounts of $26,694 in 2014 and $45,350 in 2013 Inventories Deferred income taxes Other current assets S 971,895 776,403 1,360,443 1,399,062 69,321 177,753 3,882982 932,792 2,960,201 2,021,750 93,597517,718 $9,980,140 $ 10,315.443 1,276,224 1,482,804 154,285 300,646 4,185,854 942,181 2,433,552 1,824,956 Total current assets Property, plant and equipment Intangible assets Goodwill Other assets 5 Total assets LIABILITIES AND STOCKHOLDERS' EQUITY Current liabilities Short-term borrowings Current portion oflong-term debt Accounts payable Accrued liabilities S 21,822 18,810 5,167 638,732 905,292 1,568,001 1,426,829 1,243,575 3,975 90,842 903,602 ,620,241 1,423,581 1,305,436 Total current liabilities Long-term debt Other liabilities Commitments and contingencies Stockholders' equity Preferred Stock, par value $1; shares authorized, 25,000,000; no shares outstanding in 2014 and 2013 Common Stock, stated value SO.25; shares authorized, 1,200,000,000; 432,859,891 shares outstanding in 2014 and 440,310,370 in 2013 108,215 110,078 Additional paid-in capital Accumulated other comprehensive income (loss Retained earnings 2,993,186 (702,272) 3,231.753 5,630,882 2,746,590 (211,720) 3,432,090 6,077,038 $9,980,140 $ 10,315,443 Total stockholders' equity Total liabilities and stockholders' equity See notes to consolidated financial statements. VF CORPORATION Consolidated Statements of Income Year Ended December 2013 2014 2012 In thousands, except per share amounts 12,154,784 11,302,350 S 10,766,020 113,835 Net sales Royalty income Total revenues Costs and operating expenses 127 377 17298 12,282,161 11419,648 10,879,855 Cost of goods sold 6,288,190 4,159,885 396,362 0,844,437 1,437,724 6,911 5,931,469 3,841,032 5,817,880 3,596,708 Selling, general and administrative expenses Impairment of goodwill and intangible assets 9,772,501 1,647,147 4,141 (84,773) 4,025 1,562,490 352,371 1,210,119 9,414,588 1,465,267 3,353 Operating income Interest income Interest expens (86,725) 5,544) (93,605) 46,860 1,421,875 335,737 1,086,138 139 1,210,119 S1,085,999 Other income (expense), net Income before income taxes Income taxes Net income Net income attributable to noncontrolling interests Net income attributable to VF Corporation common stockholders Earnings per common share attributa ble to VF Corporation common stockholders 1,352,366 304,861 1,047,505 s 1.047,505 1210119 1085999 2.42$ 2.38 2.76 S 2.71 Basic Diluted 2.47 2.43 $ 1.1075 0.9150 0.7575 Cash dividends per common share VF CORPORATION Consolidated Statements of Comprehensive Income Year Ended December 2013 In thousands 2014 2012 $1.047,505 S121019 086.138 Net income Other comprehensive income (loss) Foreign currency translation (469,663) 6,075 37,648 9,443 Gains (losses) arising during year 09,463 1,252 Less income tax effect Defined benefit pension plans 146,746 85,356 1,270 90,285) (203,234) 7,518 5,445 60,588 Current year actuarial gains (losses) and plan amendments Amortization of net deferred actuarial losses Amortization of deferred prior service costs (173,959) 69,744 3,357 7,013 Less income tax effect Derivative financial instruments 9,555 3,976 Gains (losses) arising during year 88,387 (34,736) 2,111 (12,619) (8,133) 3,196 (12,169) 4,782 Less income tax effect Reclassification to net income for (gains) losses realized (15,883) (401) 242,175(32,418) Less income tax effect 6,199 Marketable securities 1,239 542 Gains (losses) arising during year (698) 274 490,552 556,953 Less income tax effect Other comprehensive income (loss) 1,053,720 Comprehensive income including noncontrolling interests Comprehensive (income) loss attributable to noncontrolling interests Comprehensive income attributable to VF Corporation 1,452,294 S 556,953 S1452,294$1,053,581 See notes to consolidated financial statements. VF CORPORATION Consolidated Statements of Cash Flows Year Ended December In thousands Operating activities income S1,047,505 1,210,119 $1,086,138 Adjustments to reconcile net income to cash provided by operating activities: Impairment of goodwill and intangible assets Depreciation Amortization of intangible assets Other amortization Stock-based compensation Provision for doubtful accounts Pension expense less than contributions Deferred income taxes Gain on sale ofbusinesses Other, net Changes in operating assets and liabilities, net of purchases and sales of businesses: 396,362 172,443 42,061 60,379 104,313 (2,198) 9,864) (78,064) 157,810 45,787 49,676 148,969 47,929 41,058 15,756 (28,102) (20,198) (20,797) (44,485 (40,931) 14,306 854 130,540) 69,807 (44,144 41,989 (111,571) 87,620 (74,294) 26,213 Accounts receivable (155,053) Inventories Income taxes Other assets and liabilities 75,073 16,628 84,472 939 Accounts payable Accrued liabilities 1,697,629 1,275,000 Cash provided by operating activities 1,506,041 Investing activities Capital expenditures Business acquisitions, net of cash acquired Proceeds from sale of businesses Software purchases Other, net 234,077) (271,153) (251,940) (1,750) 72,519 (30,890) 67,943) (53,989) Cash used by investing activities (329,255) (350,273) 220,291) Financing activities Net increase (decrease) in short-term borrowings Payments on long-term debt Purchases of treasury stock Cash dividends paid Proceeds from issuance of Common Stock, net of shares withheld for taxes Tax benefits of stock-based compensation Other, net 9,032 (269,010) (2,776) (307,282) (333,229) 62,770 (404,872) (282,024) (402,136) 48,029 48,140 (4,760) (727,795) (478,933) 34,869 64,437 (802,515) 4,039 (1,107,421) (65,461) Cash used by financing activities (983,831) Effect of foreign currency rate changes on cash and equivalents Net change in cash and equivalents Cash and equivalents-beginning of year Cash and equivalents-end of year 5 2 See notes to consolidated financial statements. Consolidated Statements of Stockholders' Equity 3 Balance, December 2011 442,227,924 $110,557 $2,316,107 S (421,477) $2,520,804 S (816) 3 9 6 3 3 2 3 2 co Disposition of noncontrolling interests Defined benefit pension plans Balance, December 2012 440,818,936 S110,205 $2,527,868 S (453,895) $2,941,447 S 3 0 3 6 4 2 Foreign currency translation Defined benefit pension plans Derivative financial instruments 440,310,370 $110,078 $2,746,590 (211,720 $3,432,090 S Balance, December 2013 1 Purchase of treasury stock 4 5 3 Defined benefit pension plans Derivative financial instruments Marketable securities 73,143 (424) Balance, December 2014 4 32,859,891 $108,215 $2,993,186 (702,272) $3,231,753 See notes to consolidated financial statements