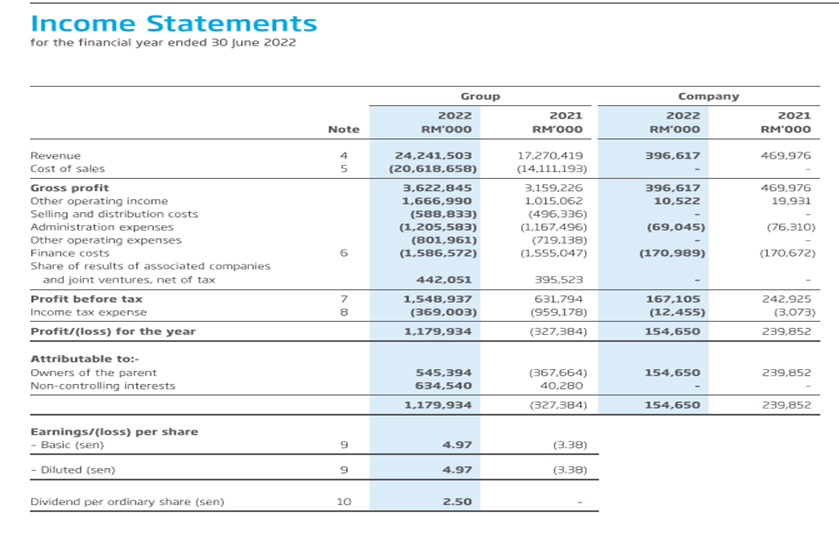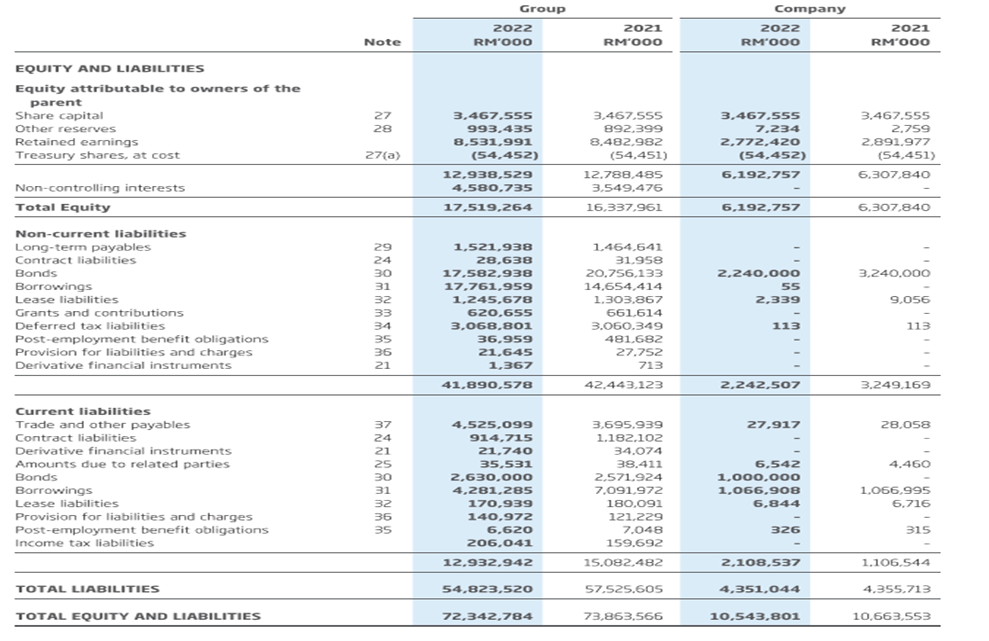

Please calculate:
- P/E ratio
- P/S ratio
- P/B ratio
Income Statements for the financial year ended 30 June 202 \begin{tabular}{|c|c|c|c|c|c|} \hline & \multirow[b]{2}{*}{ Note } & \multicolumn{2}{|c|}{ Group } & \multicolumn{2}{|c|}{ Company } \\ \hline & & \begin{aligned} 2022 \\ RMOOO \end{aligned} & \begin{tabular}{r} 2021 \\ RM'000 \end{tabular} & \begin{aligned} 2022 \\ RM'O00 \end{aligned} & \begin{aligned} 2021 \\ RM'O00 \end{aligned} \\ \hline \multicolumn{6}{|l|}{ EQUITY AND LIABILITIES } \\ \hline \multicolumn{6}{|l|}{\begin{tabular}{l} Equity attributable to owners of the \\ parent \end{tabular}} \\ \hline Share capital & 27 & 3.467 .555 & 3,467.555 & 3.467 .555 & 3.467 .555 \\ \hline Other reserves & 28 & 993,435 & 892,399 & 7,234 & 2.759 \\ \hline Retained earnings & & 8,531,991 & 8,482,982 & 2,772,420 & 2,891,977 \\ \hline Treasury shares, at cost & 27(a) & (54,452) & (54,451) & (54,452) & (54,451) \\ \hline Non-controlling interests & & \begin{tabular}{r} 12,938,529 \\ 4,580,735 \end{tabular} & \begin{tabular}{r} 12.788,485 \\ 3.549,476 \end{tabular} & 6,192,757 & 6.307,840 \\ \hline Total Equity & & 17.519 .264 & 16,337,961 & 6.192,757 & 6,307,840 \\ \hline \multicolumn{6}{|l|}{ Non-current liabilities } \\ \hline Long-term payables & 29 & 1,521,938 & 1,464,641 & - & - \\ \hline Contract liabilities & 24 & 28,638 & 31.958 & - & - \\ \hline Bonds & 30 & 17.582 .938 & 20.756,133 & 2,240,000 & 3.240 .000 \\ \hline Borrowings & 31 & 17.761 .959 & 14,654,414 & 55 & - \\ \hline Lease liabilities & 32 & 1,245,678 & 1,303,867 & 2,339 & 9,056 \\ \hline Grants and contributions & 33 & 620.655 & 661.614 & - & - \\ \hline Deferred tax liabilities & 34 & 3,068,801 & 3.060 .349 & 113 & 113 \\ \hline Post-employment benefit obligations & 35 & 36,959 & 481,682 & - & - \\ \hline Provision for liabilities and charges & 36 & 21,645 & 27.752 & - & - \\ \hline \multirow[t]{2}{*}{ Derivative financial instruments } & 21 & 1,367 & 713 & - & - \\ \hline & & 41,890,578 & 42.443 .123 & 2,242,507 & 3.249 .169 \\ \hline \multicolumn{6}{|l|}{ Current liabilities } \\ \hline Trade and other payables & 37 & 4.525,099 & 3,695,939 & 27.917 & 28,058 \\ \hline Contract liabilities & 24 & 914.715 & 1.182 .102 & - & - \\ \hline Derivative financial instruments & 21 & 21,740 & 34.074 & - & - \\ \hline Amounts due to related parties & 25 & 35,531 & 38.411 & 6.542 & 4.460 \\ \hline Bonds & 30 & 2,630,000 & 2,571,924 & 1,000,000 & - \\ \hline Borrowings & 31 & 4,281,285 & 7,091,972 & 1,066,908 & 1,066,995 \\ \hline Lease liabilities & 32 & 170,939 & 180.091 & 6,844 & 6.716 \\ \hline Provision for liabilities and charges & 36 & 140,972 & 121.229 & - & - \\ \hline Post-employment benefit obligations & 35 & 6,620 & 7.048 & 326 & 315 \\ \hline \multirow[t]{2}{*}{ Income tax liabilities } & & 206,041 & 159.692 & - & - \\ \hline & & 12,932,942 & 15.082,482 & 2,108,537 & 1.106 .544 \\ \hline TOTAL LIABILITIES & & 54,823,520 & 57.525 .605 & 4,351,044 & 4.355 .713 \\ \hline TOTAL EQUITY AND LIA & & 72,342,784 & 73,863,566 & 10,543,801 & 10,663,553 \\ \hline \end{tabular} Income Statements for the financial year ended 30 June 202 \begin{tabular}{|c|c|c|c|c|c|} \hline & \multirow[b]{2}{*}{ Note } & \multicolumn{2}{|c|}{ Group } & \multicolumn{2}{|c|}{ Company } \\ \hline & & \begin{aligned} 2022 \\ RMOOO \end{aligned} & \begin{tabular}{r} 2021 \\ RM'000 \end{tabular} & \begin{aligned} 2022 \\ RM'O00 \end{aligned} & \begin{aligned} 2021 \\ RM'O00 \end{aligned} \\ \hline \multicolumn{6}{|l|}{ EQUITY AND LIABILITIES } \\ \hline \multicolumn{6}{|l|}{\begin{tabular}{l} Equity attributable to owners of the \\ parent \end{tabular}} \\ \hline Share capital & 27 & 3.467 .555 & 3,467.555 & 3.467 .555 & 3.467 .555 \\ \hline Other reserves & 28 & 993,435 & 892,399 & 7,234 & 2.759 \\ \hline Retained earnings & & 8,531,991 & 8,482,982 & 2,772,420 & 2,891,977 \\ \hline Treasury shares, at cost & 27(a) & (54,452) & (54,451) & (54,452) & (54,451) \\ \hline Non-controlling interests & & \begin{tabular}{r} 12,938,529 \\ 4,580,735 \end{tabular} & \begin{tabular}{r} 12.788,485 \\ 3.549,476 \end{tabular} & 6,192,757 & 6.307,840 \\ \hline Total Equity & & 17.519 .264 & 16,337,961 & 6.192,757 & 6,307,840 \\ \hline \multicolumn{6}{|l|}{ Non-current liabilities } \\ \hline Long-term payables & 29 & 1,521,938 & 1,464,641 & - & - \\ \hline Contract liabilities & 24 & 28,638 & 31.958 & - & - \\ \hline Bonds & 30 & 17.582 .938 & 20.756,133 & 2,240,000 & 3.240 .000 \\ \hline Borrowings & 31 & 17.761 .959 & 14,654,414 & 55 & - \\ \hline Lease liabilities & 32 & 1,245,678 & 1,303,867 & 2,339 & 9,056 \\ \hline Grants and contributions & 33 & 620.655 & 661.614 & - & - \\ \hline Deferred tax liabilities & 34 & 3,068,801 & 3.060 .349 & 113 & 113 \\ \hline Post-employment benefit obligations & 35 & 36,959 & 481,682 & - & - \\ \hline Provision for liabilities and charges & 36 & 21,645 & 27.752 & - & - \\ \hline \multirow[t]{2}{*}{ Derivative financial instruments } & 21 & 1,367 & 713 & - & - \\ \hline & & 41,890,578 & 42.443 .123 & 2,242,507 & 3.249 .169 \\ \hline \multicolumn{6}{|l|}{ Current liabilities } \\ \hline Trade and other payables & 37 & 4.525,099 & 3,695,939 & 27.917 & 28,058 \\ \hline Contract liabilities & 24 & 914.715 & 1.182 .102 & - & - \\ \hline Derivative financial instruments & 21 & 21,740 & 34.074 & - & - \\ \hline Amounts due to related parties & 25 & 35,531 & 38.411 & 6.542 & 4.460 \\ \hline Bonds & 30 & 2,630,000 & 2,571,924 & 1,000,000 & - \\ \hline Borrowings & 31 & 4,281,285 & 7,091,972 & 1,066,908 & 1,066,995 \\ \hline Lease liabilities & 32 & 170,939 & 180.091 & 6,844 & 6.716 \\ \hline Provision for liabilities and charges & 36 & 140,972 & 121.229 & - & - \\ \hline Post-employment benefit obligations & 35 & 6,620 & 7.048 & 326 & 315 \\ \hline \multirow[t]{2}{*}{ Income tax liabilities } & & 206,041 & 159.692 & - & - \\ \hline & & 12,932,942 & 15.082,482 & 2,108,537 & 1.106 .544 \\ \hline TOTAL LIABILITIES & & 54,823,520 & 57.525 .605 & 4,351,044 & 4.355 .713 \\ \hline TOTAL EQUITY AND LIA & & 72,342,784 & 73,863,566 & 10,543,801 & 10,663,553 \\ \hline \end{tabular}


