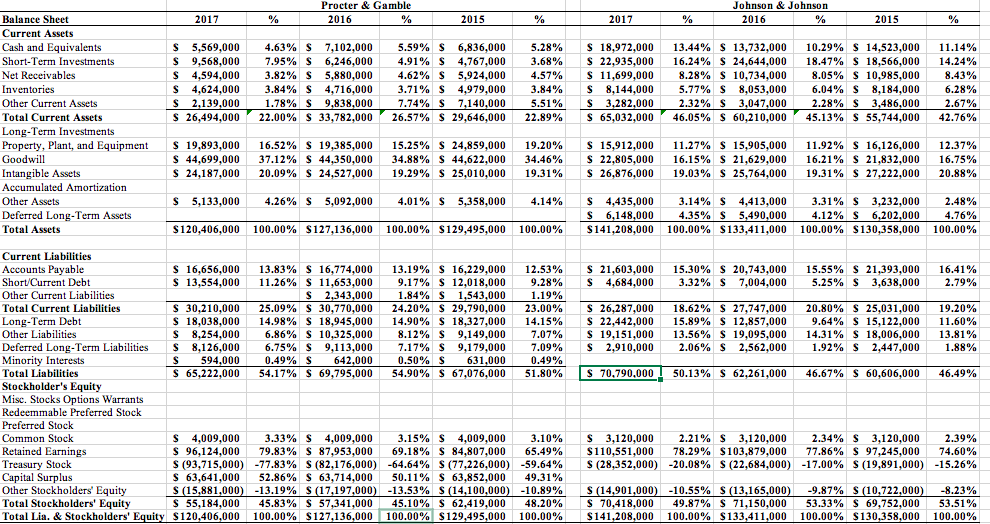

 please calculate the blue area and write the steps of the answers
Shares Outstanding (Procter & Gamble) Shares Outstanding (Johnson & Johnson) 2,540,000 2,690,000 2017 $ 65,058,000 $ 32,535,000 $ 32,523,000 % 100.00% 50.01% 49.99% Procter & Gamble 2016 % $ 65,299,000 100.00% $ 32,909,000 50.40% $ 32,390,000 49.60% 2015 $ 70,749,000 $ 37,056,000 $ 33,693,000 % 100.00% 52.38% 47.62% 2017 S 71,890,000 $ 21,685,000 S 50,205,000 % 100.00% 30.16% 69.84% Johnson & Johnson 2016 % $ 70,074,000 100.00% $ 21,536,000 30.73% $ 48,538,000 69.27% 2015 $ 74,331,000 $ 22,746,000 $ 51,585,000 % 100.00% 30.60% 69.40% S 18,568,000 28.54% $ 18,949,000 29.02% $ 22,644,000 32.01% $ 9,095,000 S 19,945,000 $ 520,000 12.65% 27.74% 0.72% S 9,046,000 $ 21,203,000 $ 733,000 12.91% 30.26% 1.05% $ 8,494,000 $ 21,954,000 S 178,000 Income Statements Total Revenue Cost of Revenue Gross Profit Operating Expenses Research Development SG&A Non Recurring Other Operating Income or Loss Other Income/Expenses (Net) EBIT Interest Expense Income Before Taxes Income Tax Expense Net Income $ 13,955,000 21.45% S (233,000) -0.36% $ 13,722,000 21.09% S 465,0000.71% $ 13,257,000 20.38% $ 3,063,000 4.71% $ 10,194,000 15.67% 519 441 441,000 20.58% S 507,000 0.78% $ 13,948,000 21.36% S 579,0000.89% $ 13,369,000 20.47% $ 3,342,000 5.12% $ 10,027,000 15.36% 13,465,000 30.71% $ 3.579.000 s 11.049,000 S 589,000 $ 11,638,000 S 626,000 $ 11,012,000 $ 2,725,000 $ 8,287,000 20.89% $ 15.62% 0.83% 16.45% 0.88% 15.56% 3.85% 11.71% 626,000 14:88% 11.43% 29.54% 0.24% 0.00% 28.20% 0.18% 28.38% 0.72% 27.66% 5.70% 21.96% $ 20,645,000 S (116,000) $ 20,529,000 $ 726,000 $ 19,803,000 S 3,263,000 $ 16,540,000 $ 28.72% -0.16% 28.56% 1.01% 27.55% 4.54% 23.01% 726,000 S 17,556,000 S 2.192.000 $ 19,748,000 S 552,000 $ 19,196,000 $ 3,787,000 $ 15,409,000 1.01% $ 0,552,000 24:79% $ 20.533,000 25.05% 3.13% 28.18% 0.79% 27.39% 5.40% 21.99% S 20.959,000 S 137,000 $ 21,096,000 S 533,000 $ 20,563,000 $ 4,240,000 $ 16,323,000 4.729 Procter & Gamble 2016 Johnson & Johnson 2016 2017 % % 2015 % 2017 2015 % S 5,569,000 $ 9,568,000 S 4,594,000 S4,624,000 S 2,139,000 $ 26,494,000 4.63% $ 7,102,000 7.95% $ 6,246,000 3.82% S 5,880,000 3.84% S4,716,000 1.78% S 9,838,000 22.00% $ 33,782,000 5.59% S 6,836,000 4.91% $ 4,767,000 4.62% S 5,924,000 3.71% S4,979,000 7.74% $ 7,140,000 26.57% $ 29,646,000 5.28% 5.28% 3.68% 4.57% 3.84% 5.51% 22.89% S 18,972,000 $ 18,972,000 $ 22,935,000 S 11,699,000 $ 8,144,000 $ 3.282.000 S 65,032,000 13.44% 13.44% 16.24% 8.28% 5.77% 2.32% 46.05% $ 13,732,000 $ 24,644,000 S 10,734,000 $ 8,053,000 $ 3,047,000 S 60,210,000 10.29% 18.47% 8.05% 6.04% 2.28% 45.13% $ 14,523,000 $ 18,566,000 S 10,985,000 $ 8,184,000 S 3,486,000 $ 55,744.000 11.14% 14.24% 8.43% 6.28% 2.67% 42.76% Balance Sheet Current Assets Cash and Equivalents Short-Term Investments Net Receivables Inventories Other Current Assets Total Current Assets Long-Term Investments Property, Plant, and Equipment Goodwill Intangible Assets Accumulated Amortization Other Assets Deferred Long-Term Assets Total Assets S 19,893,000 S 44,699,000 $ 24,187,000 16.52% 37.12% 20.09% $ 19,385,000 44,350.000 $ 24,527,000 15.25% 34.88% 19.29% $ 24,859,000 $ 44,622,000 $ 25,010,000 19.20% 34.46% 19.31% $ 15,912,000 $ 22.805.000 % 26,876,000 11.27% 16.15% 19.03% $ 15,905,000 $ 21,629,000 $ 25,764,000 11.92% 16.21% 19.31% $ 16,126,000 $ 21,832,000 $ 27,222,000 12.37% 16.75% 20.88% $ 5,133,000 4.26% $ 5,092,000 4.01% $ 5,358,000 4.14% S 4,435,000 $ 6,148,000 $141,208,000 3.14% 4.35% 100.00% S 4,413,000 $ 5,490,000 $133,411,000 3.31% 4.12% 100.00% $ 3,232,000 $ 6,202,000 $130,358,000 2.48% 4.76% 100.00% $120,406,000 100.00% $127,136,000 100.00% $129,495,000 100.00% S 21,603,000 $ 4,684,000 15.30% 3.32% S 20,743,000 S 7,004,000 15.55% 5.25% S 21,393,000 S 3,638,000 16.41% 2.79% S S 16,774,000 $ 11,653,000 S 2.343.000 S 30,770,000 $ 18,945,000 S 10.325,000 $ 9,113,000 S 642,000 S 69,795,000 13.19% 9.17% 1.84% 24.20% 14.90% 8.12% 7.17% 0.50% 54.90% S 16,229,000 $ 12,018,000 1.543.000 $ 29,790,000 $ 18,327,000 $ 9,149,000 $ 9,179,000 S 631,000 S 67,076,000 12.53% 9.28% 1.19% 23.00% 14.15% 7.07% 7.09% 0.49% 51.80% S 26,287,000 $ 22,442,000 $ 19,151,000 $ 2,910,000 18.62% 15.89% 13.56% 2.06% S 27,747,000 $ 12,857,000 $ 19,095,000 $ 2,562,000 20.80% 9.64% 14.31% 1.92% S 25,031,000 $ 15,122,000 $ 18,006,000 $ 2,447,000 19.20% 11.60% 13.81% 1.88% S 70.790.000 50.13% S 62,261,000 46.67% S 60,606,000 46.49% Current Liabilities Accounts Payable S 16,656,000 13.83% Short/Current Debt $ 13,554,000 11.26% Other Current Liabilities Total Current Liabilities S 30,210,000 25.09% Long-Term Debt $ 18,038,000 14.98% Other Liabilities S 8,254,000 6.86% Deferred Long-Term Liabilities S 8,126,000 6.75% Minority Interests S 594,000 0.49% Total Liabilities S 65,222,000 54.17% Stockholder's Equity Misc. Stocks Options Warrants Redeemmable Preferred Stock Preferred Stock Common Stock S 4,009,000 3.33% Retained Earnings S 96,124,000 79.83% Treasury Stock S (93,715,000) -77.83% Capital Surplus $ 63,641,000 52.86% Other Stockholders' Equity S (15,881,000) -13.19% Total Stockholders' Equity S 55,184,000 45.83% Total Lia. & Stockholders' Equity $120,406,000 100.00% S 3,120,000 $110,551,000 S (28,352,000) 2.21% 78.29% -20.08% S 3,120,000 $103,879,000 S (22,684,000) 2.34% 77.86% -17.00% S 3,120,000 $ 97,245,000 S (19,891,000) 2.39% 74.60% -15.26% S 4,009,000 3.15% S 4,009,000 $ 87,953,000 69.18% $ 84,807,000 S (82,176,000) -64.64% S (77,226,000) $ 63,714,000 50.11% 63,852,000 S (17,197,000) -13.53% S (14,100,000) $ 57,341,000 45.10% S 62,419,000 $127,136,000 100.00% $129,495,000 3.10% 65.49% -59.64% 49.31% -10.89% 48.20% 100.00% S (14,901,000) $ 70,418,000 S141,208,000 -10.55% 49.87% 100.00% S (13,165,000) $ 71,150,000 $133,411,000 -9.87% 53.33% 100.00% S (10,722,000) S 69,752,000 $130,358,000 -8.23% 53.51% 100.00% Solution Procter & Gamble 2016 Johnson & Johnson 2016 2017 2015 2015 Net Profit Margin Inventory Turnover Current Ratio Return on Assets Return on Equity Debt to Equity Earnings Per Share


 please calculate the blue area and write the steps of the answers


