

Answered step by step
Verified Expert Solution
Question
1 Approved Answer
Please calculate the concentration of analytes and percentages of each analytes using the Tables. Table 1. Name of analytes and retention times of standard Figure
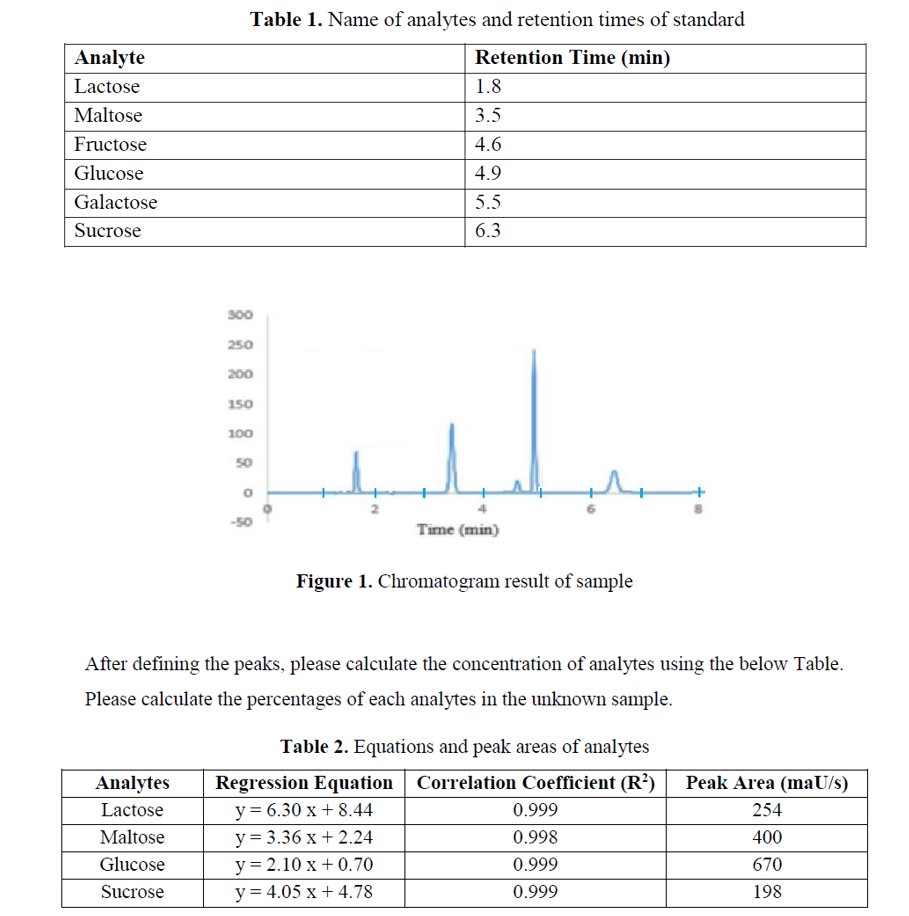
Please calculate the concentration of analytes and percentages of each analytes using the Tables.
Table 1. Name of analytes and retention times of standard Figure 1. Chromatogram result of sample After defining the peaks, please calculate the concentration of analytes using the below Table. Please calculate the percentages of each analytes in the unknown sample. Table 2. Equations and peak areas of analytesStep by Step Solution
There are 3 Steps involved in it
Step: 1

Get Instant Access to Expert-Tailored Solutions
See step-by-step solutions with expert insights and AI powered tools for academic success
Step: 2

Step: 3
Ace Your Homework with AI
Get the answers you need in no time with our AI-driven, step-by-step assistance
Get Started
Introduction To Chemical Engineering Thermodynamics
Authors: H.C. Smith, J.M. & Van Ness
2nd Edition
0070586993, 978-0070586994