Answered step by step
Verified Expert Solution
Question
1 Approved Answer
Please calculate the following ratios for the year 2016 Current Ratio Quick Ratio Net working Capital to Total Assets Cash Ratio ---------- Total Debt Ratio
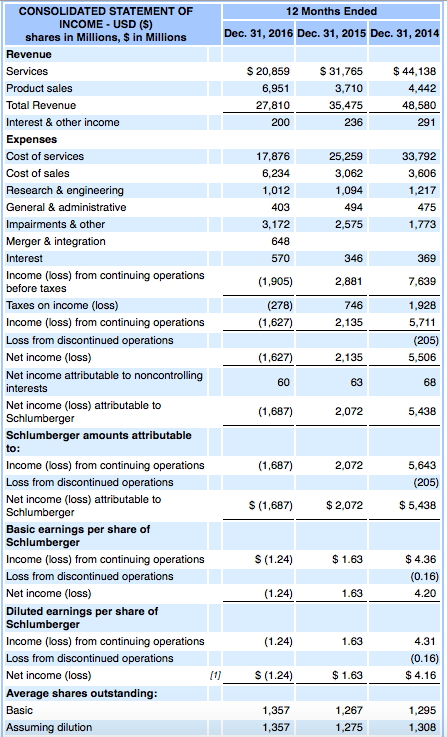
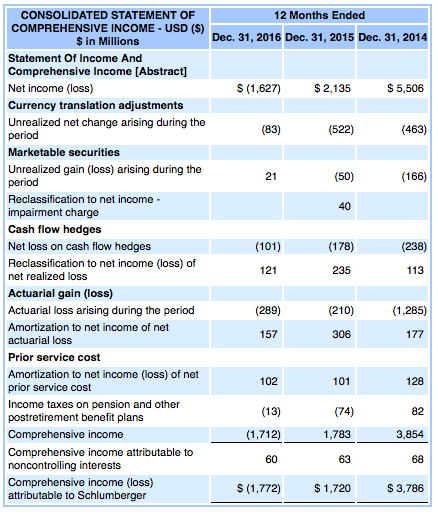
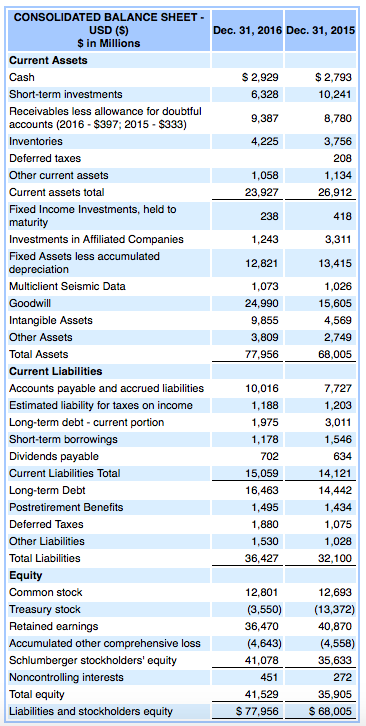
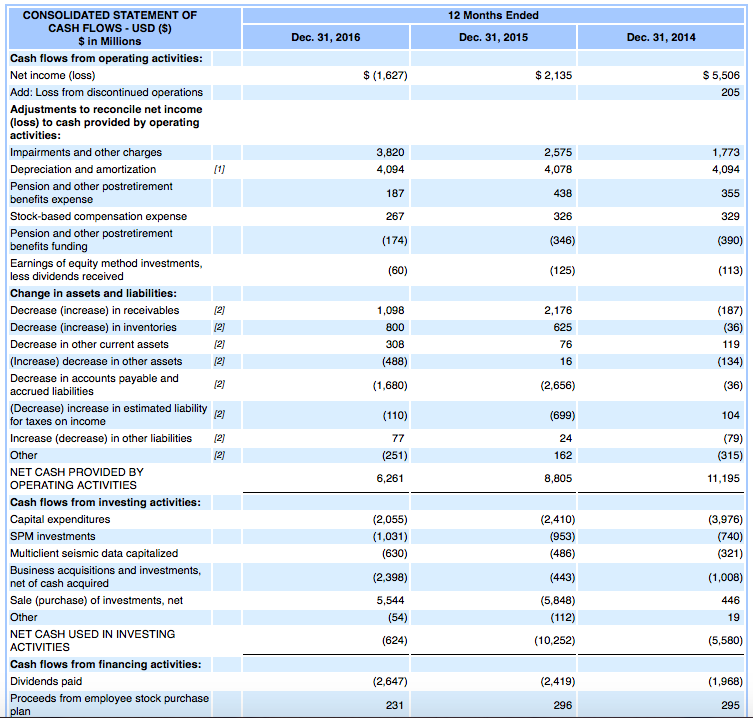
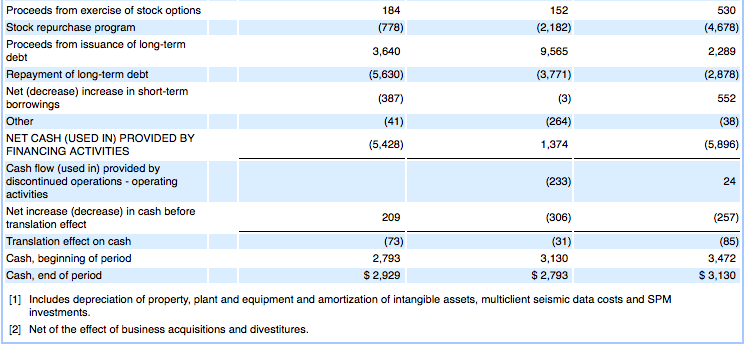
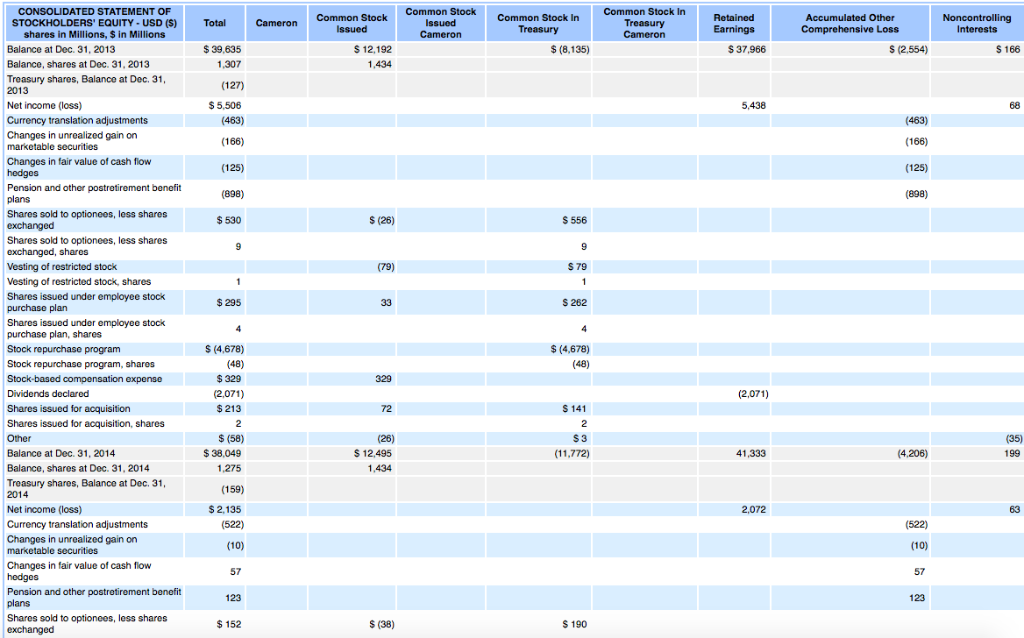
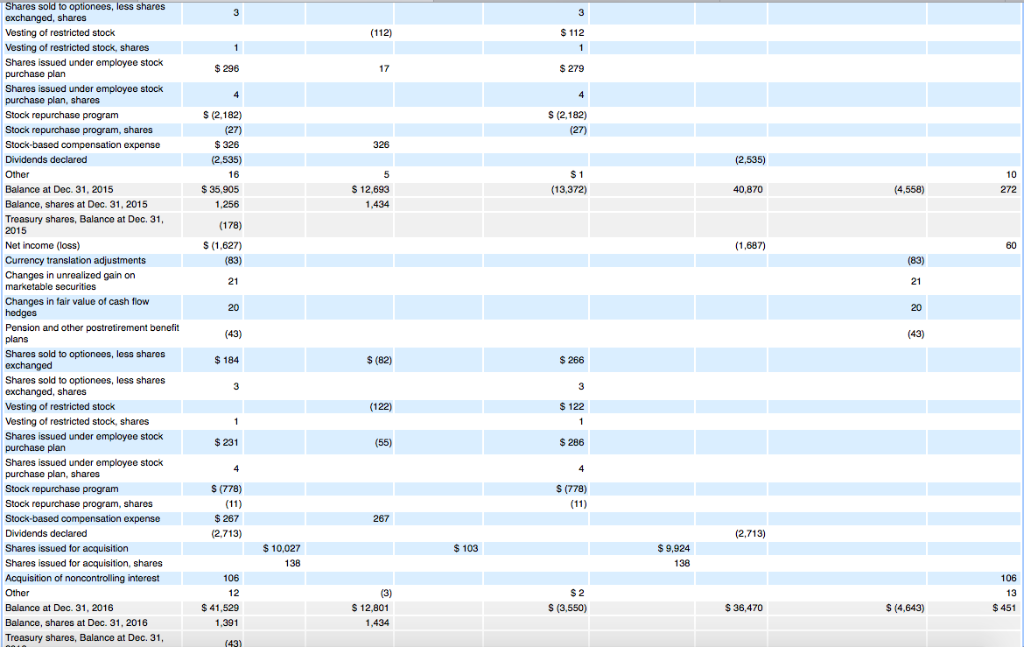
Please calculate the following ratios for the year 2016
Current Ratio
Quick Ratio
Net working Capital to Total Assets
Cash Ratio
----------
Total Debt Ratio
Debt/Equity Ratio
Cash flow from operations/total liabilities
----------
Return on Equity (ROE)
Return on Asset (ROA)
Net Profit Margin
----------
PE ratio
M/B Ratio
CONSOLIDATED STATEMENT OF INCOME -USD (S) shares in Millions, $ in Millions 12 Months Ended Dec. 31, 2016 Dec. 31, 2015 Dec. 31, 2014 Revenue s 20,859S31,765 3,710 35,475 $44,138 4,442 48,580 291 Product sales Total Revenue Interest & other income Expenses Cost of services Cost of sales Research & engineering General & administrative Impairments & other Merger & integration Interest Income (loss) from continuing operations 2 27,810 17,876 6,234 25,259 3,062 1,094 494 2,575 33,792 3,606 1,217 475 1,773 3,172 570 (1,905) (278) (1,627) 2,881 746 2,135 7,639 1,928 5,711 (205) 5,506 before taxes Taxes on income (loss) Income (loss) from continuing operations Loss from discontinued operations Net income (loss) Net income attributable to noncontrolling interests Net income (loss) attributable to Schlumberger Schlumberger amounts attributable (1,627) 2,135 2,072 5,438 Income (loss) from continuing operations Loss from discontinued operations Net income (loss) attributable to Schlumberger Basic earnings per share of Schlumberger Income (loss) from continuing operations Loss from discontinued operations Net income (loss) Diluted earnings per share of Schlumberger Income (loss) from continuing operations Loss from discontinued operations Net income (loss) Average shares outstanding (1,687) 2,072 5,643 (205) $ 5,438 (1,687) 2,072 1.24) $ 1.63 $4.36 1.63 4.20 1.63 4.31 S (1.24) 1,267 1,275 1,295 1,308 Assuming dilution 1,357 CONSOLIDATED STATEMENT OF COMPREHENSIVE INCOME USD (S) 12 Months Ended $ in Millions Dec. 31, 2016 Dec. 31, 2015 Dec. 31, 2014 Statement Of Income And Comprehensive Income [Abstract] Net income (loss) Currency translation adjustments Unrealized net change arising during the period Marketable securities Unrealized gain (loss) arising during the period Reclassification to net income impairment charge Cash flow hedges Net loss on cash flow hedges Reclassification to net income (loss) of net realized loss Actuarial gain (loss) Actuarial loss arising during the period Amortization to net income of net actuarial loss Prior service cost Amortization to net income (loss) of net prior service cost Income taxes on pension and other postretirement benefit plans S (1,627) 2,135 $5,506 (522) (463) 21 (50) (166) 40 (101) (178) (238) 121 235 113 (289) (210) (1,285) 157 306 101 128 102 (13) (1,712) 60 (74) 1,783 63 $1,720 82 3,854 68 $ 3,786 Comprehensive income attributable to noncontrolling interests Comprehensive income (loss) S (1,772) CONSOLIDATED BALANCE SHEET USD (S) $ in Millions Dec. 31, 2016 Dec. 31, 2015 Current Assets Cash Short-term investments Receivables less allowance for doubtful accounts (2016 $397; 2015 $333) Inventories Deferred taxes Other current assets Current assets total Fixed Income Investments, held to maturity Investments in Affiliated Companies Fixed Assets less accumulated depreciation Multiclient Seismic Data Goodwill Intangible Assets Other Assets Total Assets Current Liabilities Accounts payable and accrued liabilities Estimated liability for taxes on income Long-term debt current portion Short-term borrowings Dividends payable Current Liabilities Total S 2,929 6,328 9,387 4,225 $ 2,793 10,241 8,780 3,756 208 1,134 26,912 1,058 23,927 238 1,243 12,821 1,073 24,990 4153 3,311 13,415 1) 9,855 3,809 15,605 2,749 68,005 7,727 10,016 1,188 1,975 3,011 1,546 702 15,059 16,463 1,495 1,880 1,530 634 14,121 14,442 1,434 1,075 1,028 Postretirement Benefits Deferred Taxes Other Liabilities Total Liabilities Equity Common stock Treasury stock Retained earnings 12.10 12,693 (3,550 (13,372) 40,870 12,801 36,470 (4,643) (4,558 Schlumberger stockholders' equity Noncontrolling interests Total equity Liabilities and stockholders equity 35,633 272 35,905 $77,956$68,005 41,078 451 41,529 CONSOLIDATED STATEMENT OF 12 Months Ended CASH FLOWS USD (S) $ in Millions Dec. 31, 2016 Dec. 31, 2015 Dec. 31, 2014 Cash flows from operating activities Net income (loss) Add: Loss from discontinued operations Adjustments to reconcile net income (loss) to cash provided by operating activities $(1,627) $ 2,135 S 5,506 Impairments and other charges Depreciation and amortization Pension and other postretirement 3,820 4,094 187 267 (174) 2,575 4,078 1,773 4,094 355 benefits expense Stock-based compensation expense Pension and other postretirement benefits funding Earnings of equity method investments, less dividends received (346) (390) (60) (125) (113) Change in assets and liabilities Decrease (increase) in receivables 1,098 2,176 Decrease (increase) in inventories Decrease in other current assets (36) (134) (36) 104 (79) 308 (488) (1,680) 76 (Increase) decrease in other assets 12 Decrease in accounts payable and accrued liabilities (2,656) (699) 24 162 8,805 (Decrease) increase in estimated liability for taxes on income Increase (decrease) in other liabilities 2) (251) NET CASH PROVIDED BY OPERATING ACTIVITIES Cash flows from investing activities Capital expenditures SPM investments Multiclient seismic data capitalized Business acquisitions and investments, net of cash acquired Sale (purchase) of investments, net 6,261 11,195 (2,055) (1,031) (630) (2,398) 5,544 (54) (624) (2,410) (3,976) (321) (1,008) (486) (443) (5,848) (112) (10,252) NET CASH USED IN INVESTING ACTIVITIES Cash flows from financing activities: Dividends paid Proceeds from employee stock purchase (5,580) (2,647) (2,419) (1,968) 231 295 Proceeds from exercise of stock options Stock repurchase program Proceeds from issuance of long-term 184 (778) 3,640 (5,630) (387) (41) (5,428) 152 (2,182) 9,565 (3,771) (4,678) 2,289 (2,878) Repayment of long-term debt Net (decrease) increase in short-term (264) (38) NET CASH (USED IN) PROVIDED BY FINANCING ACTIVITIES Cash flow (used in) provided by discontinued operations operating 1,374 (5,896) (233) 24 Net increase (decrease) in cash before (306) (31) 3,130 $ 2,793 (257) translation effect Translation effect on cash Cash, beginning of period Cash, end of period (73) 2,793 $ 2,929 (85) 3,472 $ 3,130 [1] Includes depreciation of property, plant and equipment and amortization of intangible assets, multiclient seismic data costs and SPM 2] Net of the effect of business acquisitions and divestitures. CONSOLIDATED STATEMENT OF STOCKHOLDERS' EQUITY-USD (S) shares in Millions, $ in Millions Common Stock In Common Stock In Accumulated Other Total Cameron Common Stock Common Stock Balance at Dec. 31, 2013 Balance, shares at Dec. 31, 2013 Treasury shares, Balance at Dec. 31 S 12,192 1,434 $ (8,135) S 37,966 S 166 $ 5,506 5,438 Changes in unrealized gain on Changes in fair value of cash fiow Shares sold to optionees, less shares (26) S 556 Shares sold to optionees, less shares (79) Vesting of restricted stock, shares Shares issued under employee stock $ 295 262 Shares issued under employee stock program (4,678) Stock repurchase program, shares (2,071) Shares issued for acquisition, shares Balance at Dec. 31, 2014 Balance, shares at Dec. 31, 2014 Treasury shares, Balance at Dec. 31 S 12,495 1,434 11,772) 41,333 (4.206) 199 $ 2,135 2,072 Changes in unrealized gain on Changes in fair value of cash fiow Pension and other postretirement benefit Shares sold to optionees, less shares 123 (38) S 190 (112) 17 s (2182) (2,535) (2,535) 10 $ 12,693 1,434 (13,372) Balance at Dec. 31, 2015 Balance, shares at Dec. 31, 2015 40,870 4,558) 272 (1,687) marketable securities Changes in fair value of cash flow (43) Vesting of restricted stock, shares $ 286 s (778) Stock repurchase program, shares (2,713) $10,027 138 $ 103 $ 9,924 138 shares Acquisition of noncontrolling interest 106 S 2 s (3,550) S 12,801 Balance at Dec. 31, 2016 Balance, shares at Dec. 31, 2016 Treasury shares, Balance at Dec. 31 S36,470 (4,643)
Step by Step Solution
There are 3 Steps involved in it
Step: 1

Get Instant Access to Expert-Tailored Solutions
See step-by-step solutions with expert insights and AI powered tools for academic success
Step: 2

Step: 3

Ace Your Homework with AI
Get the answers you need in no time with our AI-driven, step-by-step assistance
Get Started


