

Answered step by step
Verified Expert Solution
Question
1 Approved Answer
Please calculate the following ratios (The changes between years must be included in the calculations): Profitability ratios Gross profit Margin (Sales-COGS)/Sales Operating Profit Margin Operating
Please calculate the following ratios (The changes between years must be included in the calculations):
- Profitability ratios
-
Gross profit Margin (Sales-COGS)/Sales Operating Profit Margin Operating Income/Sales Netprofit Margin PAT/Sales ROA PAT/ Total Assets ROI PAT/(LT Debt+ SH Equity) EPS
-
- Liquidity ratios
-
Current Ratio CA/CL Working Capital CA-CL
-
- Leverage ratios
-
Total Debt to asset Total Liab/Total Assets LT debt to capital LT debt/(LT debt+SH Equity) Debt to equity Total Liab/SH equity LT Debt to equity LT debt/SH equity Interest Coverage Ratio Operating Income/ Interst Expense
-
- Activity ratios
-
Days of Inventory Inventory/(COGS/365) Inventory Turnover COGS/Inventory Average Collection Period Accounts Rcblr/(Sales/365)
-
- Price-to-earnings ratio
-
PE ratio CMP/EPS
-
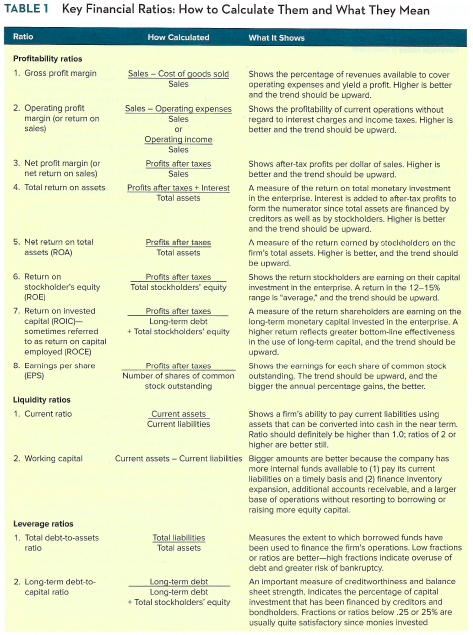
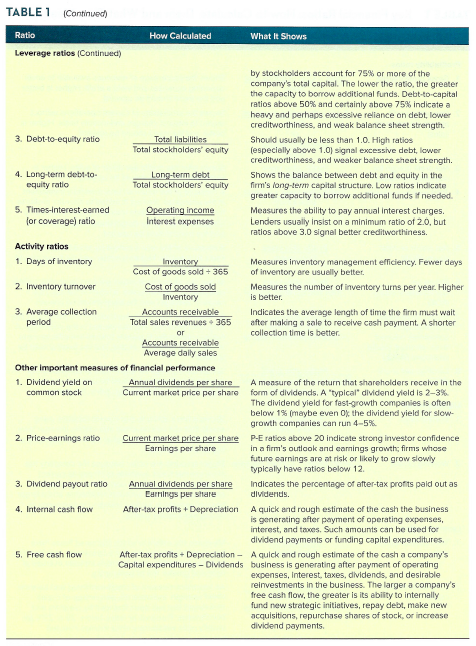
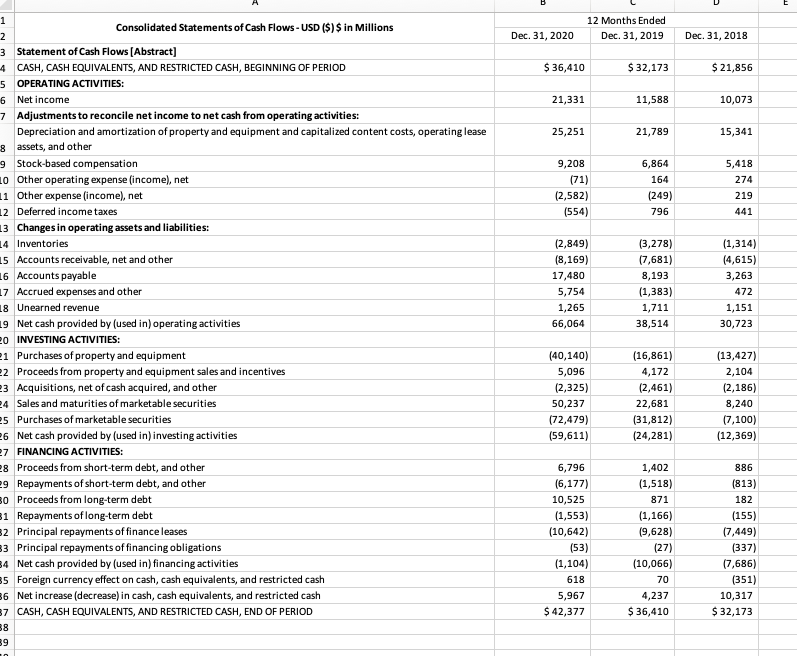
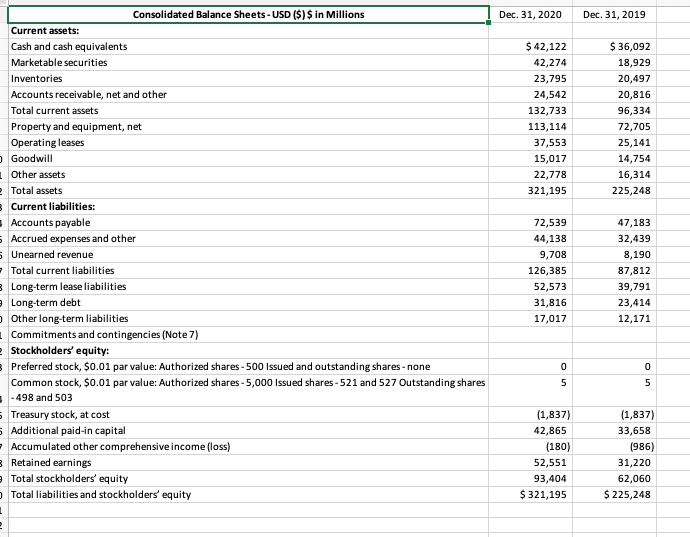
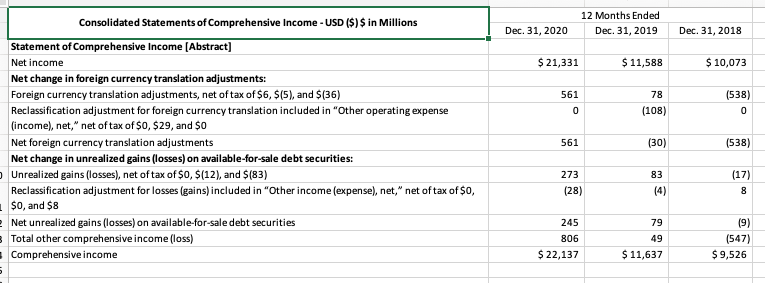
TABLE 1 Key Financial Ratios: How to Calculate Them and What They Mean Ratio How Calculated What It Shows Profitability ratios 1. Gross profit margin Sales-Cost of goods sold Sales Shows the percentage of revenues available to cover operating expenses and yield a profit. Higher is better and the trend should be upward. Shows the profitability of current operations without regard to interest charges and income taxes. Higher is better and the trend should be upward. 2. Operating profit margin for return on sales) Sales - Operating expenses Sales or Operating income Sales Profits after taxes Sales Profits after taxes + Interest Total assets 3. Net profit margin for net return on sales) 4. Total return on assets 5. Net return on total assets (ROA) Profits after taxes Total assets Profits after taxes Total stockholders' equity 6. Return on stockholder's equity IROEI 7. Return on invested capital (ROICH- Sometimes referred to as return on capital employed ROCE) 8. Earnings per share (EPS) Shows after-tax profits per dollar of sales. Higher is better and the trend should be upward. A measure of the return on total monetary investment in the enterprise. Interest is added to after-tax profits to form the numerator since total assets are financed by creditors as well as by stockholders. Higher is better and the trend should be upward. A measure of the return comed by stocleholders on the firm's total assets. Higher is better, and the trend should be upward. Shows the return stockholders are earning on their capital investment in the enterprise. A return in the 12-15% range is "average, and the trend should be upward. A measure of the return shareholders are earning on the long-term monetary capital invested in the enterprise. A higher retum reflects greater bottom-line effectiveness in the use of long-term capital, and the trend should be upward. Shows the earnings for each share of common stock outstanding. The trend should be upward, and the bigger the annual percentage gains, the better. Profits after taxes Long-term debt + Total stockholders' equity Profits after taxes Number of shares of common stock outstanding Liquidity ratios 1. Current ratio 2. Working capital Current assets Shows a firm's ability to pay current liabilities using Current liabilities assets that can be corrverted into cash in the near term. Ratio should definitely be higher than 1.0, ratios of 2 or higher are better stil Current assets - Current liabilities Bigger amounts are better because the company has more internal funds available to (1) pay its current liabilities on a timely basis and (2) finance inventory expansion, additional accounts receivable, and a larger base of operations without resorting to borrowing or raising more equity capital Leverage ratios 1. Total debt-to-assets ratio Total llabilities Total assets 2. Long-term debt-to- capital ratio Long-term debt Long-term debt Total stockholders' equity Measures the extent to which borrowed funds have been used to finance the firm's operations. Low fractions or ratios are better-high fractions indicate overuse of debt and greater risk of bankruptcy. An important measure of creditworthiness and balance sheet strength. Indicates the percentage of capital investment that has been financed by creditors and bondholders. Fractions or ratios below.25 or 25% are usually quite satisfactory since monies invested TABLE 1 (Continued Ratio How Calculated What It Shows Leverage ratios (Continued) by stockholders account for 75% or more of the company's total capital. The lower the ratio, the greater the capacity to borrow additional funds. Debt-to-capital ratios above 50% and certainly above 75% indicate a heavy and perhaps excessive reliance on debt, lower creditworthiness, and weak balance sheet strength. 3. Debt-to-equity ratio Total liabilities Should usually be less than 1.0. High ratios Total stockholders' equity (especially above 1.0) Signal excessive debt, lower creditworthiness, and weaker balance sheet strength. 4. Long-term debito Long-term debt Shows the balance between debt and equity in the equity ratio Total stockholders' equity firm's long-term capital structure. Low ratios indicate greater capacity to borrow additional funds if needed. 5. Times-interest-eamed Operating Income Measures the ability to pay annual interest charges. for coverage) ratio Interest expenses Lenders usually insist on a minimum ratio of 2.0, but ratios above 3.0 signal better creditworthiness. Activity ratios 1. Days of inventory Inventory Measures inventory management efficiency. Fewer days Cost of goods sold + 365 of inventory are usually better 2. Inventory turnover Cost of goods sold Measures the number of inventory turns per year. Higher Inventory is better. 3. Average collection Accounts receivable Indicates the average length of time the firm must wait period Total sales revenues 365 after making a sale to receive cash payment. A shorter or collection time is better Accounts receivable Average daily sales Other important measures of financial performance 1. Dividend yield on Annual dividends per share A measure of the return that shareholders receive in the common stock Current market price per share form of dividends. A typical' dividend yield is 2-3% The dividend yield for fast-growth companies is often below 1% (maybe even the dividend yield for slow- growth companies can run 4-5% 2. Price-earnings ratio Current market price per shere P-E ratios above 20 indicete strong investor confidence Earnings per share in a firm's outlook and earnings growth, firms whose future earnings are at risk or likely to grow slowly typically have ratios below 12. 3. Dividend payout ratio Annual dividends per share Indicates the percentage of after-tax profits paid out as Earrings per share dividends. 4. Internal cash flow After-tax profits + Depreciation A quick and rough estimate of the cash the business is generating after payment of operating expenses, interest, and taxes. Such amounts can be used for dividend payments or funding capital expenditures. 5. Free cash flow After-tax profits + Depreciation - A quick and rough estimate of the cash a company's Capital expenditures - Dividends business is generating after payment of operating expenses, Interest, taxes, dividends, and desirable reinvestments in the business. The larger a company's free cash flow, the greater is its ability to internally fund new strategic initiatives, repay debt, make new acquisitions, repurchase shares of stock, or increase dividend payments E 12 Months Ended Dec. 31, 2019 Dec. 31, 2020 Dec. 31, 2018 $36,410 $ 32,173 $ 21,856 21,331 11,588 10,073 25,251 21,789 15,341 5,418 274 9,208 (71) (2,582) (554) 6,864 164 (249) 796 219 441 1 Consolidated Statements of Cash Flows - USD ($) $ in Millions 2 3 Statement of Cash Flows (Abstract] 4 CASH, CASH EQUIVALENTS, AND RESTRICTED CASH, BEGINNING OF PERIOD 5 OPERATING ACTIVITIES: 6 Net income 7 Adjustments to reconcile net income to net cash from operating activities: Depreciation and amortization of property and equipment and capitalized content costs, operating lease 8 assets, and other 9 Stock-based compensation Lo Other operating expense (income), net 11 Other expense (income), net 12 Deferred income taxes 13 Changes in operating assets and liabilities: 14 Inventories 15 Accounts receivable, net and other 16 Accounts payable 17 Accrued expenses and other 18 Unearned revenue 19 Net cash provided by (used in) operating activities 20 INVESTING ACTIVITIES: 21 Purchases of property and equipment 22 Proceeds from property and equipment sales and incentives 3 Acquisitions, net of cash acquired, and other 24 Sales and maturities of marketable securities 5 Purchases of marketable securities 26 Net cash provided by (used in) investing activities 27 FINANCING ACTIVITIES: 8 Proceeds from short-term debt, and other 9 Repayments of short-term debt, and other 0 Proceeds from long-term debt 31 Repayments of long-term debt 2 Principal repayments of finance leases 3 Principal repayments of financing obligations 4 Net cash provided by (used in) financing activities 5 Foreign currency effect on cash, cash equivalents, and restricted cash 36 Net increase (decrease) in cash, cash equivalents, and restricted cash 7 CASH, CASH EQUIVALENTS, AND RESTRICTED CASH, END OF PERIOD 8 (2,849) (8,169) 17,480 5,754 1,265 66,064 (3,278) (7,681) 8,193 (1,383) 1,711 38,514 (1,314) (4,615) 3,263 472 1,151 30,723 (40,140) 5,096 (2,325) 50,237 (72,479) (59,611) (16,861) 4,172 (2,461) 22,681 (31,812) (24,281) (13,427) 2,104 (2,186) 8,240 (7,100) (12,369) 6,796 (6,177) 10,525 (1,553) (10,642) (53) (1,104) 618 5,967 $ 42,377 1,402 (1,518) 871 (1,166) 19,628) (27) (10,066) 70 4,237 $36,410 886 (813) 182 (155) (7,449) (337) (7,686) (351) 10,317 $32,173 39 Dec. 31, 2020 Dec. 31, 2019 $ 42,122 42,274 23,795 24,542 132,733 113,114 37,553 15,017 22,778 321,195 $36,092 18,929 20,497 20,816 96,334 72,705 25,141 14,754 16,314 225,248 Consolidated Balance Sheets - USD ($) $ in Millions Current assets: Cash and cash equivalents Marketable securities Inventories Accounts receivable, net and other Total current assets Property and equipment, net Operating leases Goodwill Other assets 2 Total assets Current liabilities: Accounts payable Accrued expenses and other Unearned revenue Total current liabilities Long-term lease liabilities Long-term debt Other long-term liabilities Commitments and contingencies (Note 7) Stockholders' equity: Preferred stock, $0.01 par value: Authorized shares - 500 Issued and outstanding shares - none Common stock, $0.01 par value: Authorized shares - 5,000 Issued shares - 521 and 527 Outstanding shares - 498 and 503 Treasury stock, at cost Additional paid-in capital Accumulated other comprehensive income (loss) 5 Retained earnings Total stockholders' equity Total liabilities and stockholders' equity 1 72,539 44,138 9,708 126,385 52,573 31,816 17,017 47,183 32,439 8,190 87,812 39,791 23,414 12,171 0 0 5 5 (1,837) 42,865 (180) 52,551 93,404 $ 321,195 (1,837) 33,658 (986) 31,220 62,060 $225,248 2 12 Months Ended Dec 31, 2019 Dec. 31, 2020 Dec 31, 2018 $ 21,331 $ 11,588 $ 10,073 561 78 (108) (538) 0 0 Consolidated Statements of Comprehensive Income - USD ($) $ in Millions Statement of Comprehensive Income (Abstract] Net income Net change in foreign currency translation adjustments: Foreign currency translation adjustments, net of tax of $6, $(5), and $(36) Reclassification adjustment for foreign currency translation included in "Other operating expense (income), net," net of tax of $0, $29, and $0 Net foreign currency translation adjustments Net change in unrealized gains (losses) on available-for-sale debt securities: Unrealized gains (losses), net of tax of $0, $(12), and $(83) Reclassification adjustment for losses (gains) included in "Other income (expense), net," net of tax of $o, $0, and $8 Net unrealized gains (losses) on available-for-sale debt securities Total other comprehensive income (loss) Comprehensive income 561 (30) (538) 273 (28) 83 (4) (17) 8 245 79 806 $ 22,137 49 $ 11,637 (9) (547) $ 9,526 TABLE 1 Key Financial Ratios: How to Calculate Them and What They Mean Ratio How Calculated What It Shows Profitability ratios 1. Gross profit margin Sales-Cost of goods sold Sales Shows the percentage of revenues available to cover operating expenses and yield a profit. Higher is better and the trend should be upward. Shows the profitability of current operations without regard to interest charges and income taxes. Higher is better and the trend should be upward. 2. Operating profit margin for return on sales) Sales - Operating expenses Sales or Operating income Sales Profits after taxes Sales Profits after taxes + Interest Total assets 3. Net profit margin for net return on sales) 4. Total return on assets 5. Net return on total assets (ROA) Profits after taxes Total assets Profits after taxes Total stockholders' equity 6. Return on stockholder's equity IROEI 7. Return on invested capital (ROICH- Sometimes referred to as return on capital employed ROCE) 8. Earnings per share (EPS) Shows after-tax profits per dollar of sales. Higher is better and the trend should be upward. A measure of the return on total monetary investment in the enterprise. Interest is added to after-tax profits to form the numerator since total assets are financed by creditors as well as by stockholders. Higher is better and the trend should be upward. A measure of the return comed by stocleholders on the firm's total assets. Higher is better, and the trend should be upward. Shows the return stockholders are earning on their capital investment in the enterprise. A return in the 12-15% range is "average, and the trend should be upward. A measure of the return shareholders are earning on the long-term monetary capital invested in the enterprise. A higher retum reflects greater bottom-line effectiveness in the use of long-term capital, and the trend should be upward. Shows the earnings for each share of common stock outstanding. The trend should be upward, and the bigger the annual percentage gains, the better. Profits after taxes Long-term debt + Total stockholders' equity Profits after taxes Number of shares of common stock outstanding Liquidity ratios 1. Current ratio 2. Working capital Current assets Shows a firm's ability to pay current liabilities using Current liabilities assets that can be corrverted into cash in the near term. Ratio should definitely be higher than 1.0, ratios of 2 or higher are better stil Current assets - Current liabilities Bigger amounts are better because the company has more internal funds available to (1) pay its current liabilities on a timely basis and (2) finance inventory expansion, additional accounts receivable, and a larger base of operations without resorting to borrowing or raising more equity capital Leverage ratios 1. Total debt-to-assets ratio Total llabilities Total assets 2. Long-term debt-to- capital ratio Long-term debt Long-term debt Total stockholders' equity Measures the extent to which borrowed funds have been used to finance the firm's operations. Low fractions or ratios are better-high fractions indicate overuse of debt and greater risk of bankruptcy. An important measure of creditworthiness and balance sheet strength. Indicates the percentage of capital investment that has been financed by creditors and bondholders. Fractions or ratios below.25 or 25% are usually quite satisfactory since monies invested TABLE 1 (Continued Ratio How Calculated What It Shows Leverage ratios (Continued) by stockholders account for 75% or more of the company's total capital. The lower the ratio, the greater the capacity to borrow additional funds. Debt-to-capital ratios above 50% and certainly above 75% indicate a heavy and perhaps excessive reliance on debt, lower creditworthiness, and weak balance sheet strength. 3. Debt-to-equity ratio Total liabilities Should usually be less than 1.0. High ratios Total stockholders' equity (especially above 1.0) Signal excessive debt, lower creditworthiness, and weaker balance sheet strength. 4. Long-term debito Long-term debt Shows the balance between debt and equity in the equity ratio Total stockholders' equity firm's long-term capital structure. Low ratios indicate greater capacity to borrow additional funds if needed. 5. Times-interest-eamed Operating Income Measures the ability to pay annual interest charges. for coverage) ratio Interest expenses Lenders usually insist on a minimum ratio of 2.0, but ratios above 3.0 signal better creditworthiness. Activity ratios 1. Days of inventory Inventory Measures inventory management efficiency. Fewer days Cost of goods sold + 365 of inventory are usually better 2. Inventory turnover Cost of goods sold Measures the number of inventory turns per year. Higher Inventory is better. 3. Average collection Accounts receivable Indicates the average length of time the firm must wait period Total sales revenues 365 after making a sale to receive cash payment. A shorter or collection time is better Accounts receivable Average daily sales Other important measures of financial performance 1. Dividend yield on Annual dividends per share A measure of the return that shareholders receive in the common stock Current market price per share form of dividends. A typical' dividend yield is 2-3% The dividend yield for fast-growth companies is often below 1% (maybe even the dividend yield for slow- growth companies can run 4-5% 2. Price-earnings ratio Current market price per shere P-E ratios above 20 indicete strong investor confidence Earnings per share in a firm's outlook and earnings growth, firms whose future earnings are at risk or likely to grow slowly typically have ratios below 12. 3. Dividend payout ratio Annual dividends per share Indicates the percentage of after-tax profits paid out as Earrings per share dividends. 4. Internal cash flow After-tax profits + Depreciation A quick and rough estimate of the cash the business is generating after payment of operating expenses, interest, and taxes. Such amounts can be used for dividend payments or funding capital expenditures. 5. Free cash flow After-tax profits + Depreciation - A quick and rough estimate of the cash a company's Capital expenditures - Dividends business is generating after payment of operating expenses, Interest, taxes, dividends, and desirable reinvestments in the business. The larger a company's free cash flow, the greater is its ability to internally fund new strategic initiatives, repay debt, make new acquisitions, repurchase shares of stock, or increase dividend payments E 12 Months Ended Dec. 31, 2019 Dec. 31, 2020 Dec. 31, 2018 $36,410 $ 32,173 $ 21,856 21,331 11,588 10,073 25,251 21,789 15,341 5,418 274 9,208 (71) (2,582) (554) 6,864 164 (249) 796 219 441 1 Consolidated Statements of Cash Flows - USD ($) $ in Millions 2 3 Statement of Cash Flows (Abstract] 4 CASH, CASH EQUIVALENTS, AND RESTRICTED CASH, BEGINNING OF PERIOD 5 OPERATING ACTIVITIES: 6 Net income 7 Adjustments to reconcile net income to net cash from operating activities: Depreciation and amortization of property and equipment and capitalized content costs, operating lease 8 assets, and other 9 Stock-based compensation Lo Other operating expense (income), net 11 Other expense (income), net 12 Deferred income taxes 13 Changes in operating assets and liabilities: 14 Inventories 15 Accounts receivable, net and other 16 Accounts payable 17 Accrued expenses and other 18 Unearned revenue 19 Net cash provided by (used in) operating activities 20 INVESTING ACTIVITIES: 21 Purchases of property and equipment 22 Proceeds from property and equipment sales and incentives 3 Acquisitions, net of cash acquired, and other 24 Sales and maturities of marketable securities 5 Purchases of marketable securities 26 Net cash provided by (used in) investing activities 27 FINANCING ACTIVITIES: 8 Proceeds from short-term debt, and other 9 Repayments of short-term debt, and other 0 Proceeds from long-term debt 31 Repayments of long-term debt 2 Principal repayments of finance leases 3 Principal repayments of financing obligations 4 Net cash provided by (used in) financing activities 5 Foreign currency effect on cash, cash equivalents, and restricted cash 36 Net increase (decrease) in cash, cash equivalents, and restricted cash 7 CASH, CASH EQUIVALENTS, AND RESTRICTED CASH, END OF PERIOD 8 (2,849) (8,169) 17,480 5,754 1,265 66,064 (3,278) (7,681) 8,193 (1,383) 1,711 38,514 (1,314) (4,615) 3,263 472 1,151 30,723 (40,140) 5,096 (2,325) 50,237 (72,479) (59,611) (16,861) 4,172 (2,461) 22,681 (31,812) (24,281) (13,427) 2,104 (2,186) 8,240 (7,100) (12,369) 6,796 (6,177) 10,525 (1,553) (10,642) (53) (1,104) 618 5,967 $ 42,377 1,402 (1,518) 871 (1,166) 19,628) (27) (10,066) 70 4,237 $36,410 886 (813) 182 (155) (7,449) (337) (7,686) (351) 10,317 $32,173 39 Dec. 31, 2020 Dec. 31, 2019 $ 42,122 42,274 23,795 24,542 132,733 113,114 37,553 15,017 22,778 321,195 $36,092 18,929 20,497 20,816 96,334 72,705 25,141 14,754 16,314 225,248 Consolidated Balance Sheets - USD ($) $ in Millions Current assets: Cash and cash equivalents Marketable securities Inventories Accounts receivable, net and other Total current assets Property and equipment, net Operating leases Goodwill Other assets 2 Total assets Current liabilities: Accounts payable Accrued expenses and other Unearned revenue Total current liabilities Long-term lease liabilities Long-term debt Other long-term liabilities Commitments and contingencies (Note 7) Stockholders' equity: Preferred stock, $0.01 par value: Authorized shares - 500 Issued and outstanding shares - none Common stock, $0.01 par value: Authorized shares - 5,000 Issued shares - 521 and 527 Outstanding shares - 498 and 503 Treasury stock, at cost Additional paid-in capital Accumulated other comprehensive income (loss) 5 Retained earnings Total stockholders' equity Total liabilities and stockholders' equity 1 72,539 44,138 9,708 126,385 52,573 31,816 17,017 47,183 32,439 8,190 87,812 39,791 23,414 12,171 0 0 5 5 (1,837) 42,865 (180) 52,551 93,404 $ 321,195 (1,837) 33,658 (986) 31,220 62,060 $225,248 2 12 Months Ended Dec 31, 2019 Dec. 31, 2020 Dec 31, 2018 $ 21,331 $ 11,588 $ 10,073 561 78 (108) (538) 0 0 Consolidated Statements of Comprehensive Income - USD ($) $ in Millions Statement of Comprehensive Income (Abstract] Net income Net change in foreign currency translation adjustments: Foreign currency translation adjustments, net of tax of $6, $(5), and $(36) Reclassification adjustment for foreign currency translation included in "Other operating expense (income), net," net of tax of $0, $29, and $0 Net foreign currency translation adjustments Net change in unrealized gains (losses) on available-for-sale debt securities: Unrealized gains (losses), net of tax of $0, $(12), and $(83) Reclassification adjustment for losses (gains) included in "Other income (expense), net," net of tax of $o, $0, and $8 Net unrealized gains (losses) on available-for-sale debt securities Total other comprehensive income (loss) Comprehensive income 561 (30) (538) 273 (28) 83 (4) (17) 8 245 79 806 $ 22,137 49 $ 11,637 (9) (547) $ 9,526
Step by Step Solution
There are 3 Steps involved in it
Step: 1

Get Instant Access to Expert-Tailored Solutions
See step-by-step solutions with expert insights and AI powered tools for academic success
Step: 2

Step: 3
Ace Your Homework with AI
Get the answers you need in no time with our AI-driven, step-by-step assistance
Get Started
Political Economy Of Money And Finance 1999
Authors: Makoto Itoh, Costas Lapavitsas, Makoto Itō
1st Edition
033366521X, 9780333665213