Answered step by step
Verified Expert Solution
Question
1 Approved Answer
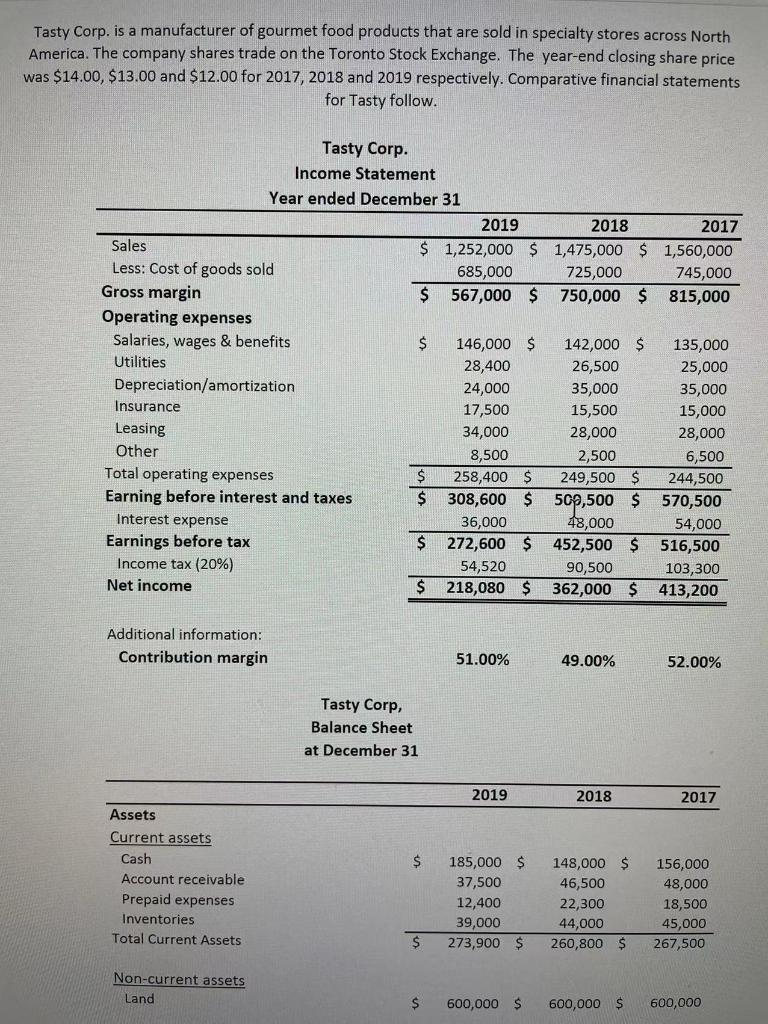
Please calculate the profit margin and gross profit margin for each year Tasty Corp. is a manufacturer of gourmet food products that are sold in


Please calculate the profit margin and gross profit margin for each year
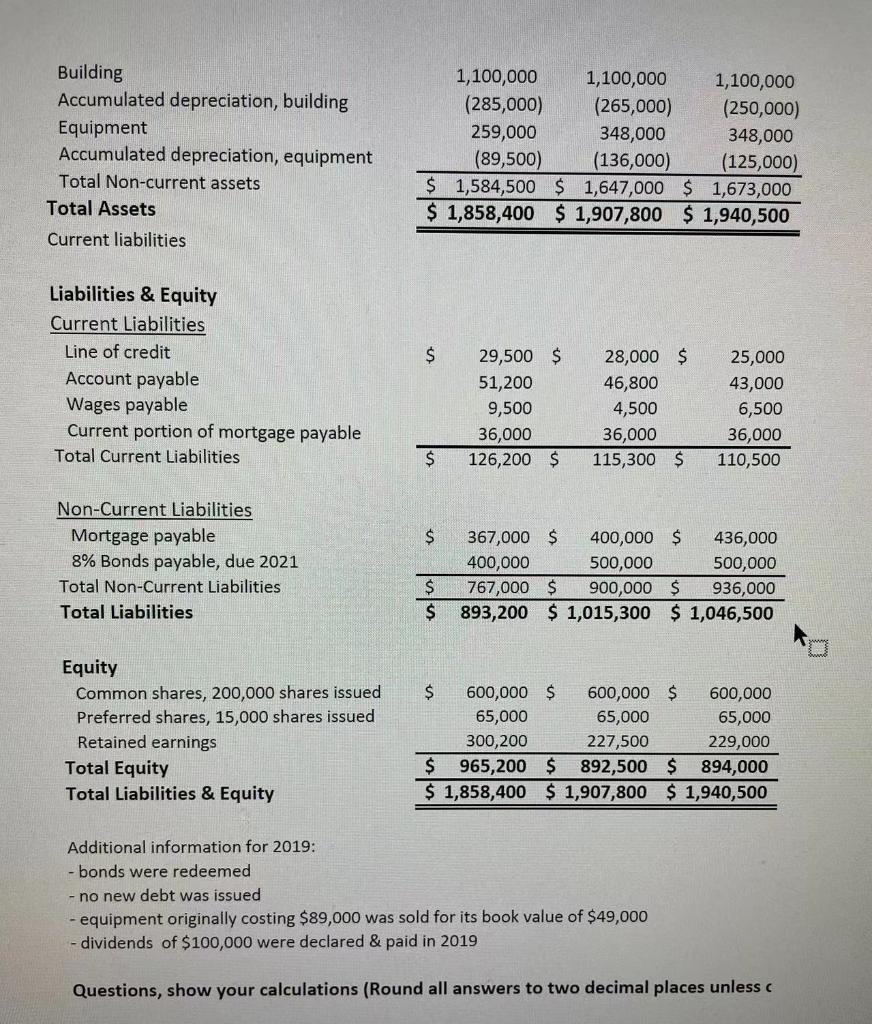
Tasty Corp. is a manufacturer of gourmet food products that are sold in specialty stores across North America. The company shares trade on the Toronto Stock Exchange. The year-end closing share price was $14.00, $13.00 and $12.00 for 2017, 2018 and 2019 respectively. Comparative financial statements for Tasty follow. Tasty Corp. Income Statement Year ended December 31 2019 2018 2017 Sales $ 1,252,000 $1,475,000 $ 1,560,000 Less: Cost of goods sold 685,000 725,000 745,000 Gross margin $ 567,000 $750,000 $ 815,000 Operating expenses Salaries, wages & benefits $ 146,000 $ 142,000 $ 135,000 Utilities 28,400 26,500 25,000 Depreciation/amortization 24,000 35,000 35,000 Insurance 17,500 15,500 15,000 Leasing 34,000 28,000 28,000 Other 8,500 2,500 6,500 Total operating expenses $ 258,400 $ 249,500 $ 244,500 Earning before interest and taxes $ 308,600 $ 500,500 $ 570,500 Interest expense 36,000 48,000 54,000 Earnings before tax $ 272,600 $ 452,500 $ 516,500 Income tax (20%) 54,520 90,500 103,300 Net income $ 218,080 $ 362,000 $ 413,200 Additional information: Contribution margin 51.00% 49.00% 52.00% Tasty Corp, Balance Sheet at December 31 2019 2018 2017 Assets $ Current assets Cash Account receivable Prepaid expenses Inventories Total Current Assets 185,000 $ 37,500 12,400 39,000 273,900 $ 148,000 $ 46,500 22,300 44,000 260,800 $ 156,000 48,000 18,500 45,000 267,500 $ Non-current assets Land $ 600,000 $ 600,000 $ 600,000 Building Accumulated depreciation, building Equipment Accumulated depreciation, equipment Total Non-current assets Total Assets Current liabilities 1,100,000 1,100,000 1,100,000 (285,000) (265,000) (250,000) 259,000 348,000 348,000 (89,500) (136,000) (125,000) $ 1,584,500 $ 1,647,000 $ 1,673,000 $ 1,858,400 $ 1,907,800 $ 1,940,500 $ Liabilities & Equity Current Liabilities Line of credit Account payable Wages payable Current portion of mortgage payable Total Current Liabilities 29,500 $ 51,200 9,500 36,000 126,200 $ 28,000 $ 46,800 4,500 36,000 115,300 $ 25,000 43,000 6,500 36,000 110,500 $ $ Non-Current Liabilities Mortgage payable 8% Bonds payable, due 2021 Total Non-Current Liabilities Total Liabilities 367,000 $ 400,000 $ 436,000 400,000 500,000 500,000 767,000 $ 900,000 $ 936,000 893,200 $ 1,015,300 $ 1,046,500 $ $ Equity Common shares, 200,000 shares issued Preferred shares, 15,000 shares issued Retained earnings Total Equity Total Liabilities & Equity $ 600,000 $ 600,000 $ 600,000 65,000 65,000 65,000 300,200 227,500 229,000 $ 965,200 $ 892,500 $ 894,000 $ 1,858,400 $ 1,907,800 $ 1,940,500 Additional information for 2019: - bonds were redeemed -no new debt was issued equipment originally costing $89,000 was sold for its book value of $49,000 - dividends of $100,000 were declared & paid in 2019 Questions, show your calculations (Round all answers to two decimal places unless
Step by Step Solution
There are 3 Steps involved in it
Step: 1

Get Instant Access to Expert-Tailored Solutions
See step-by-step solutions with expert insights and AI powered tools for academic success
Step: 2

Step: 3

Ace Your Homework with AI
Get the answers you need in no time with our AI-driven, step-by-step assistance
Get Started


