please can you do these few questions!!! I'm submitting two attachments seperate.
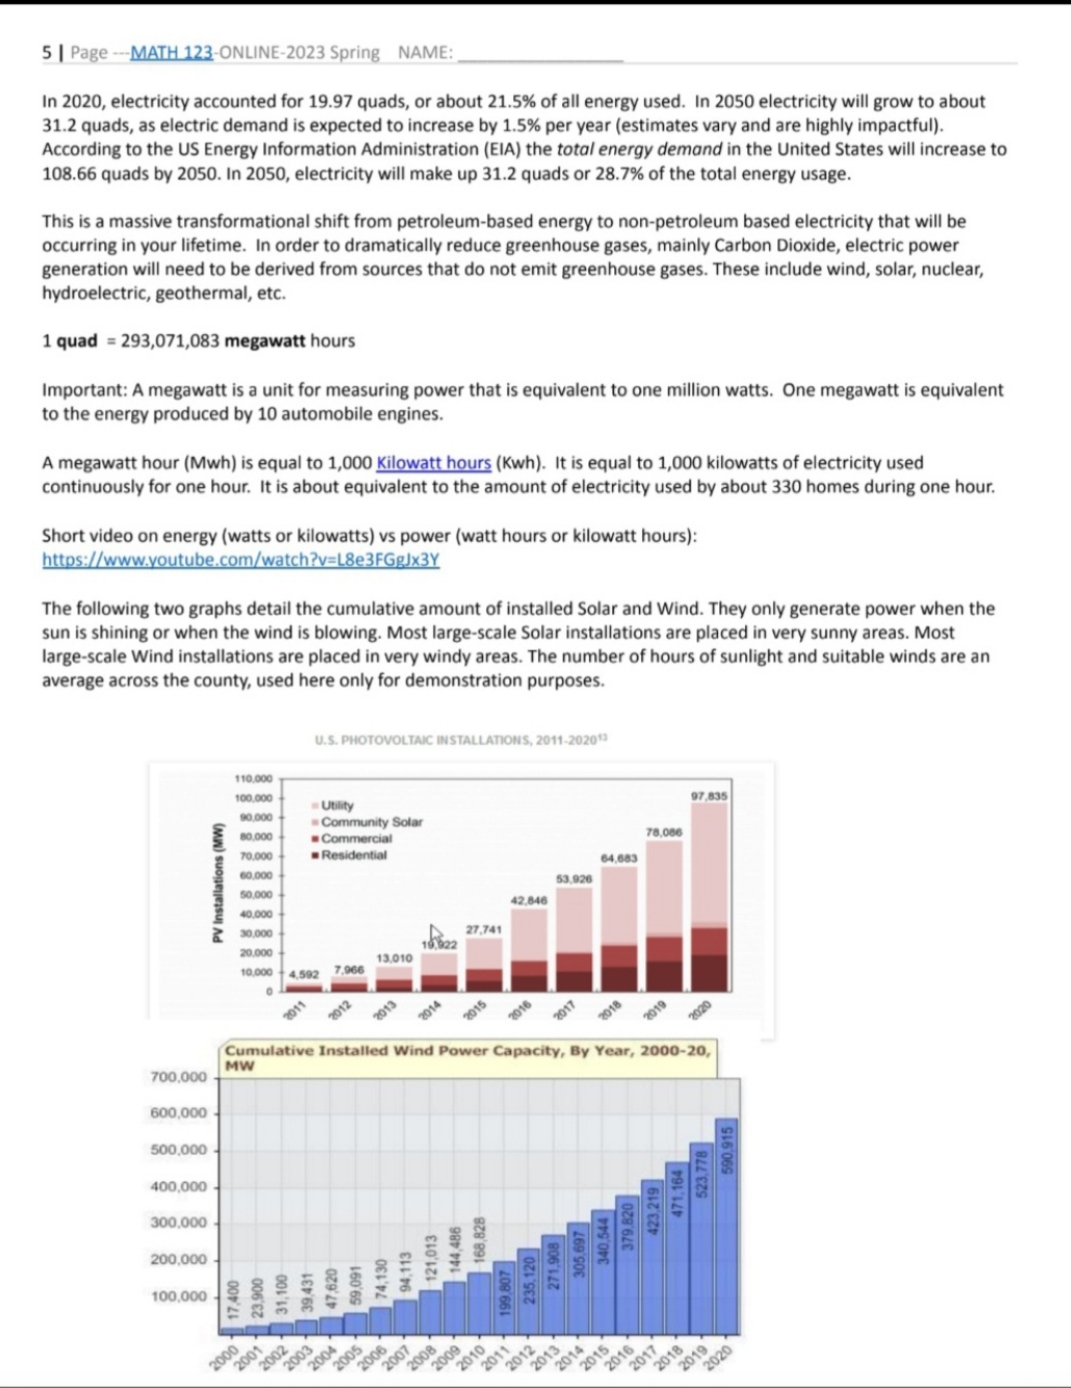
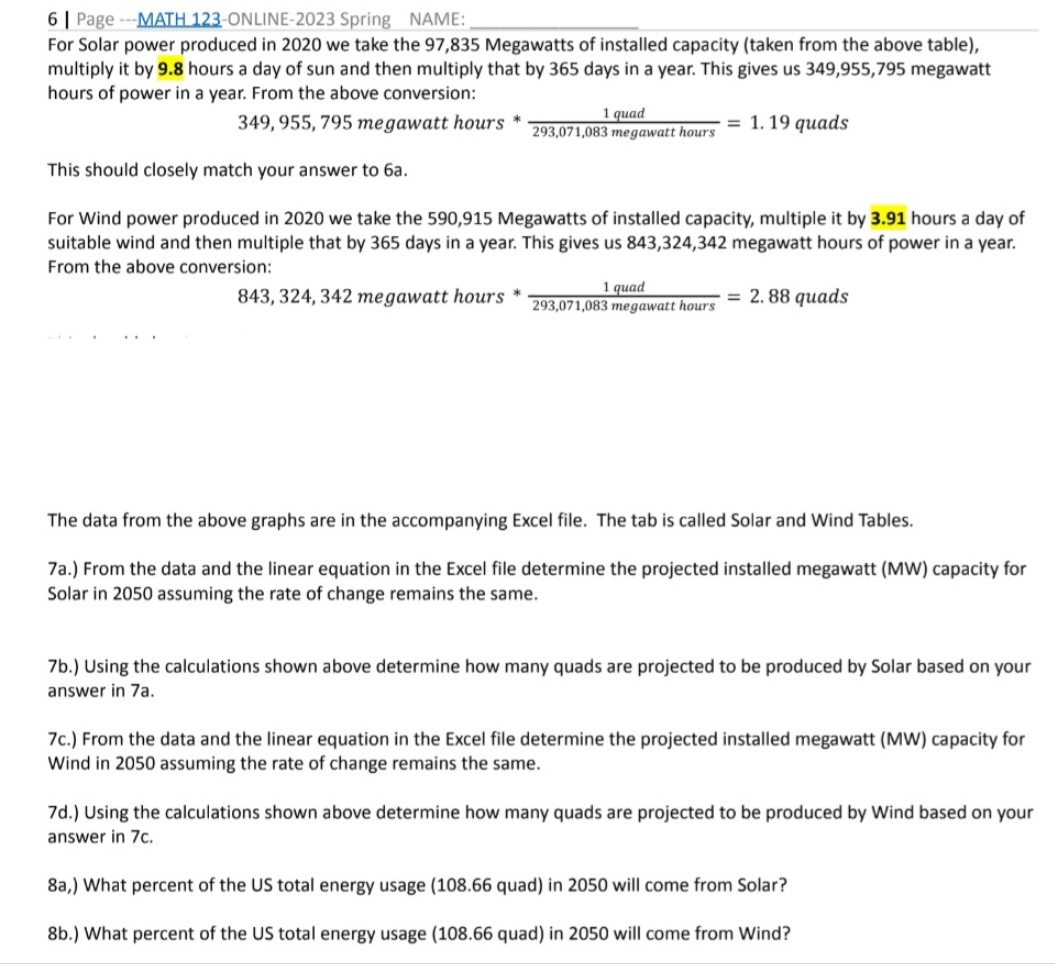
5 | Page -MATH 123-ONLINE-2023 Spring NAME: - In 2020, electricity accounted for 19.97 quads, or about 21.5% of all energy used. In 2050 electricity will grow to about 31.2 quads, as electric demand is expected to increase by 1.5% per year (estimates vary and are highly impactful). According to the US Energy Information Administration (EIA) the total energy demand in the United States will increase to 108.66 quads by 2050. In 2050, electricity will make up 31.2 quads or 28.7% of the total energy usage. This is a massive transformational shift from petroleum-based energy to non-petroleum based electricity that will be occurring in your lifetime. In order to dramatically reduce greenhouse gases, mainly Carbon Dioxide, electric power generation will need to be derived from sources that do not emit greenhouse gases. These include wind, solar, nuclear, hydroelectric, geothermal, etc. 1 quad = 293,071,083 megawatt hours Important: A megawatt is a unit for measuring power that is equivalent to one million watts. One megawatt is equivalent to the energy produced by 10 automobile engines. A megawatt hour (Mwh) is equal to 1,000 Kilowatt hours (Kwh). It is equal to 1,000 kilowatts of electricity used continuously for one hour. It is about equivalent to the amount of electricity used by about 330 homes during one hour. Short video on energy (watts or kilowatts) vs power (watt hours or kilowatt hours): httos://www. .com/watch?v= FGgix3Y The following two graphs detail the cumulative amount of installed Solar and Wind. They only generate power when the sun is shining or when the wind is blowing. Most large-scale Solar installations are placed in very sunny areas. Most large-scale Wind installations are placed in very windy areas. The number of hours of sunlight and suitable winds are an average across the county, used here only for demonstration purposes. P& EE LI | Cumulative Installed Wind Power Capacity, By Year, 2000-20, Mw 500.000 400,000 300 000 200,000 100.000 FEEEFEEE EE S S % 6 | Page ---MATH 123-ONLINE-2023 Spring NAME: For Solar power produced in 2020 we take the 97,835 Megawatts of installed capacity (taken from the above table), multiply it by 9.8 hours a day of sun and then multiply that by 365 days in a year. This gives us 349,955,795 megawatt hours of power in a year. From the above conversion: 1 quad = 349, 955, 795 megawatt hours * 793,071,083 megawait howrs. = 1.19 quads This should closely match your answer to 6a. For Wind power produced in 2020 we take the 590,915 Megawatts of installed capacity, multiple it by 3.91 hours a day of suitable wind and then multiple that by 365 days in a year. This gives us 843,324,342 megawatt hours of power in a year. From the above conversion: 843,324, 342 megawatt hours * L guad 293,071,083 megawait hours. 2 88 quads The data from the above graphs are in the accompanying Excel file, The tab is called Solar and Wind Tables. 7a.) From the data and the linear equation in the Excel file determine the projected installed megawatt (MW) capacity for Solar in 2050 assuming the rate of change remains the same. 7b.) Using the calculations shown above determine how many quads are projected to be produced by Solar based on your answer in 7a. 7c.) From the data and the linear equation in the Excel file determine the projected installed megawatt (MW) capacity for Wind in 2050 assuming the rate of change remains the same. 7d.) Using the calculations shown above determine how many quads are projected to be produced by Wind based on your answer in 7c. 8a,) What percent of the US total energy usage (108.66 quad) in 2050 will come from Solar? 8b.) What percent of the US total energy usage (108.66 quad) in 2050 will come from Wind