

Answered step by step
Verified Expert Solution
Question
1 Approved Answer
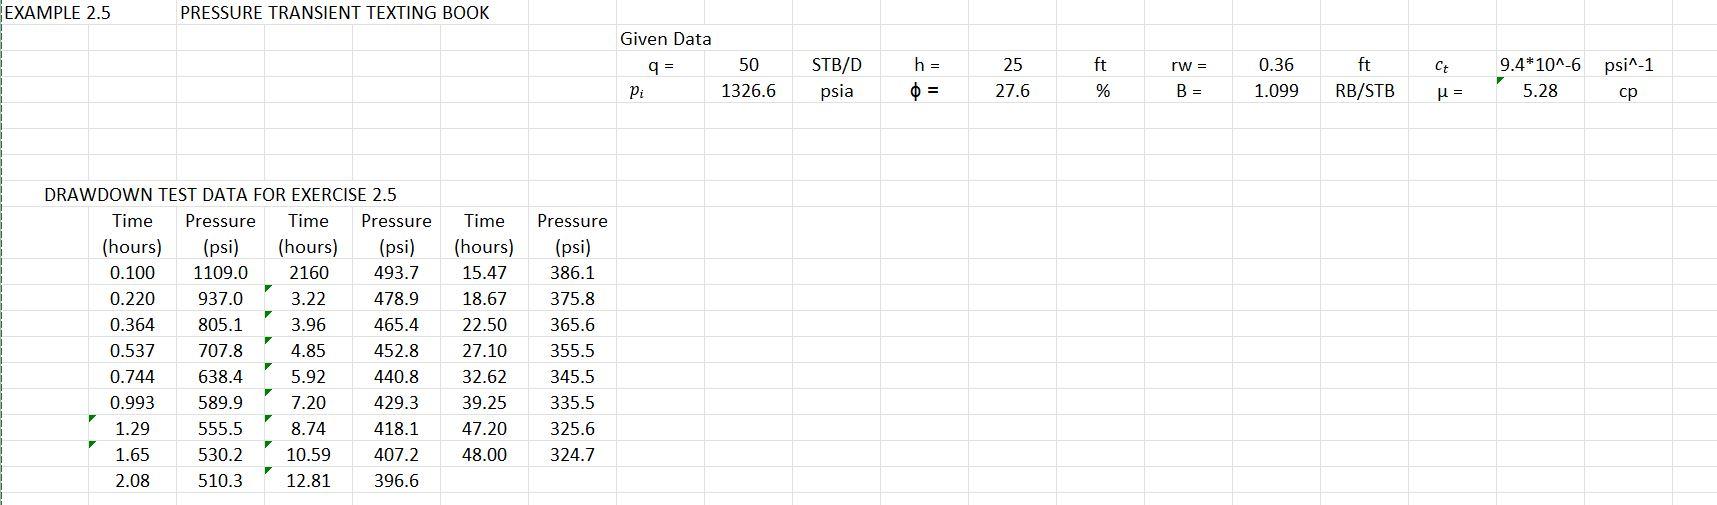
please can you show me how can make semi log and log log graph in excel example EXAMPLE 2.5 PRESSURE TRANSIENT TEXTING BOOK Given Data
please can you show me how can make semi log and log log graph in excel
example
Step by Step Solution
There are 3 Steps involved in it
Step: 1

Get Instant Access to Expert-Tailored Solutions
See step-by-step solutions with expert insights and AI powered tools for academic success
Step: 2

Step: 3
Ace Your Homework with AI
Get the answers you need in no time with our AI-driven, step-by-step assistance
Get Started
MongoDB 4 Quick Start Guide Learn The Skills You Need To Work With The World S Most Popular NoSQL Database
Authors: Doug Bierer
1st Edition
1789343534, 978-1789343533