

Answered step by step
Verified Expert Solution
Question
1 Approved Answer
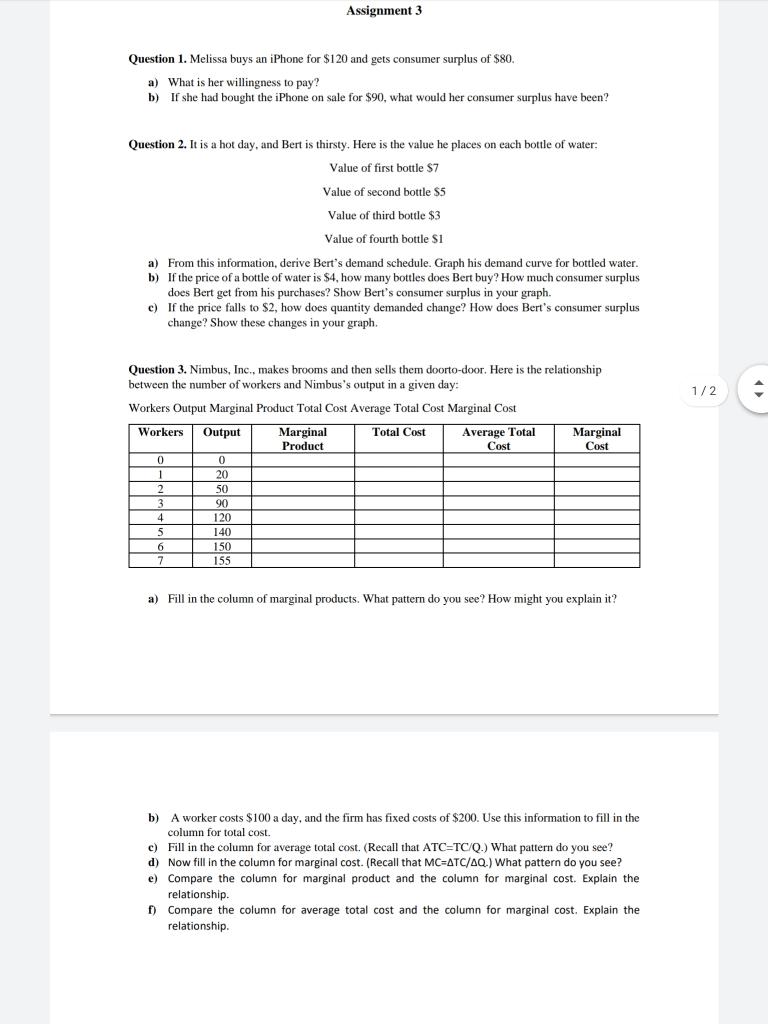
please can you solve the above questions Assignment 3 Question 1. Melissa buys an iPhone for $120 and gets consumer surplus of $80. a) What
 please can you solve the above questions
Step by Step Solution
There are 3 Steps involved in it
Step: 1

Get Instant Access to Expert-Tailored Solutions
See step-by-step solutions with expert insights and AI powered tools for academic success
Step: 2

Step: 3
Ace Your Homework with AI
Get the answers you need in no time with our AI-driven, step-by-step assistance
Get Started
Essentials Of Applied Econometrics
Authors: Aaron D Smith, J Edward Taylor
1st Edition
0520288335, 9780520288331