Please can you with help me with these problems. I tried to work on them tirelessly but I don't understand it. However am allow to consult a tutor for help. I will appreciate your help.
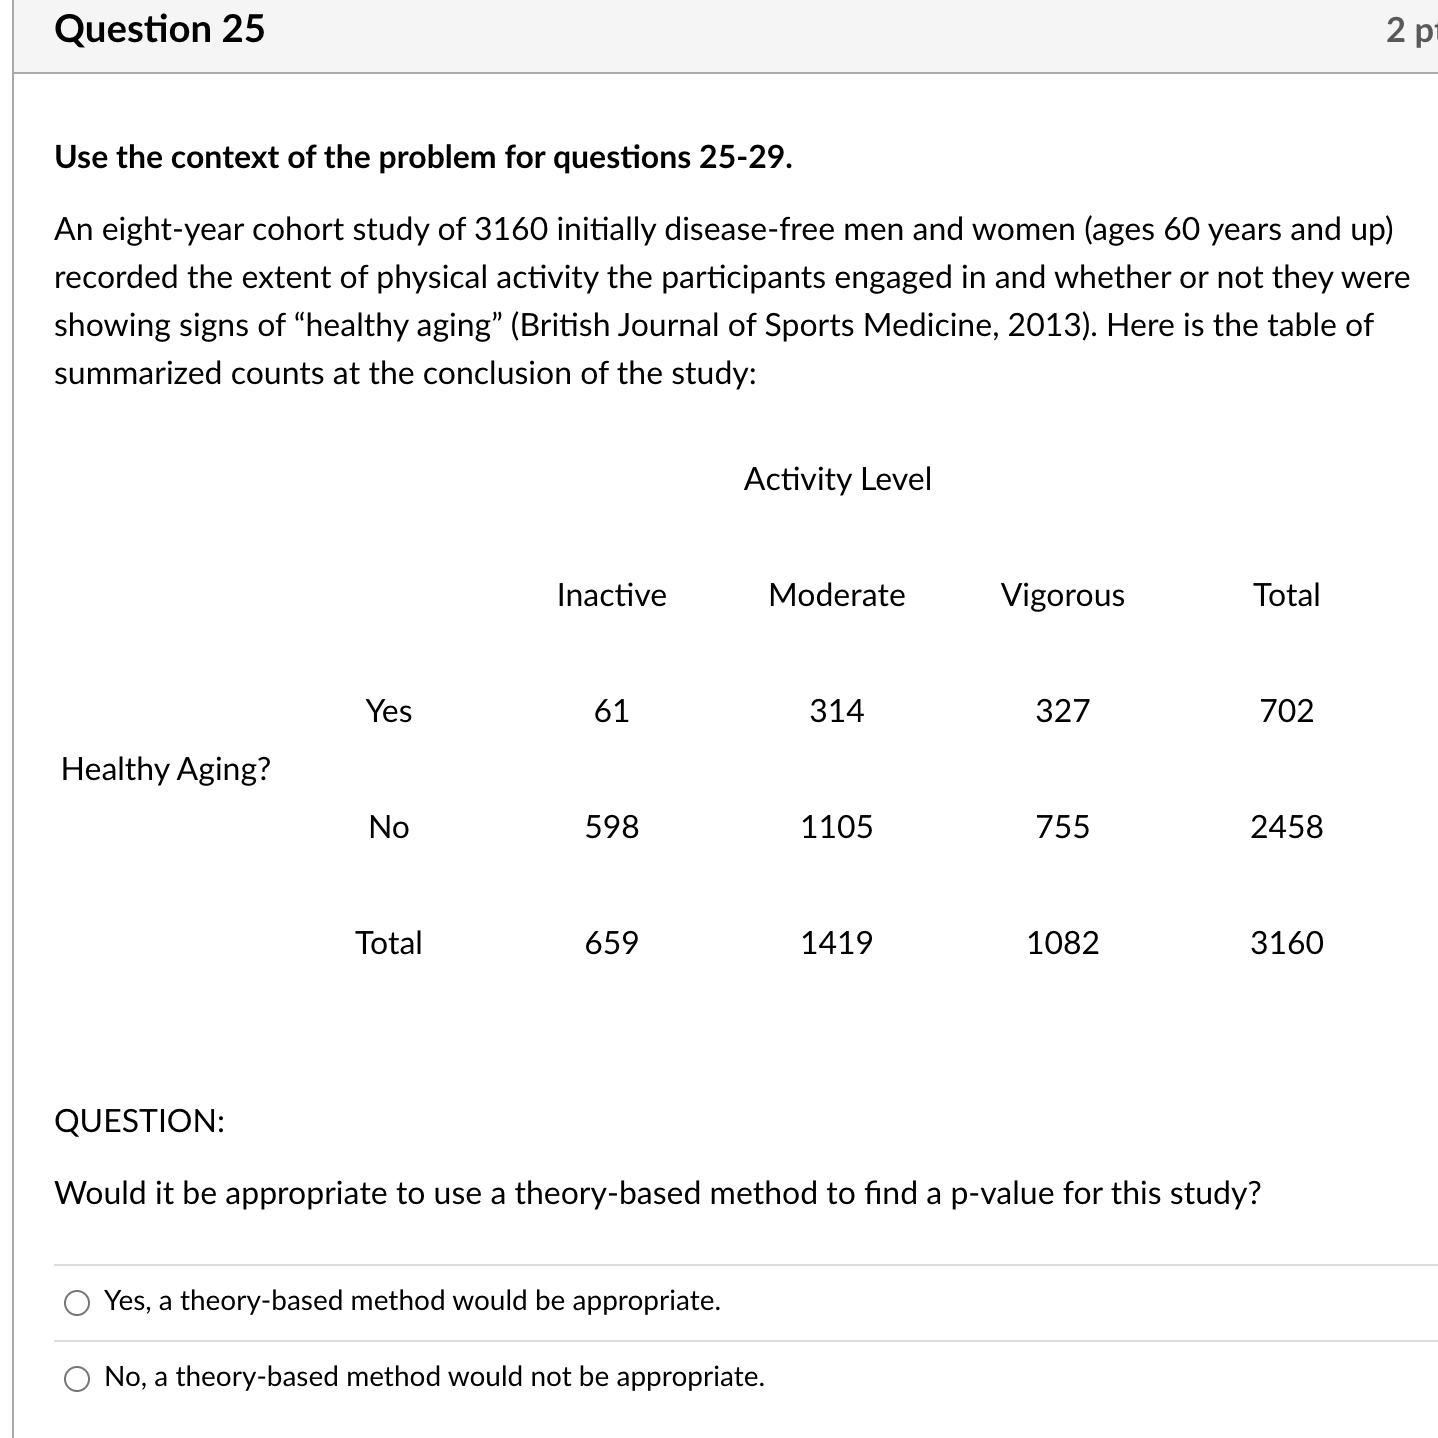
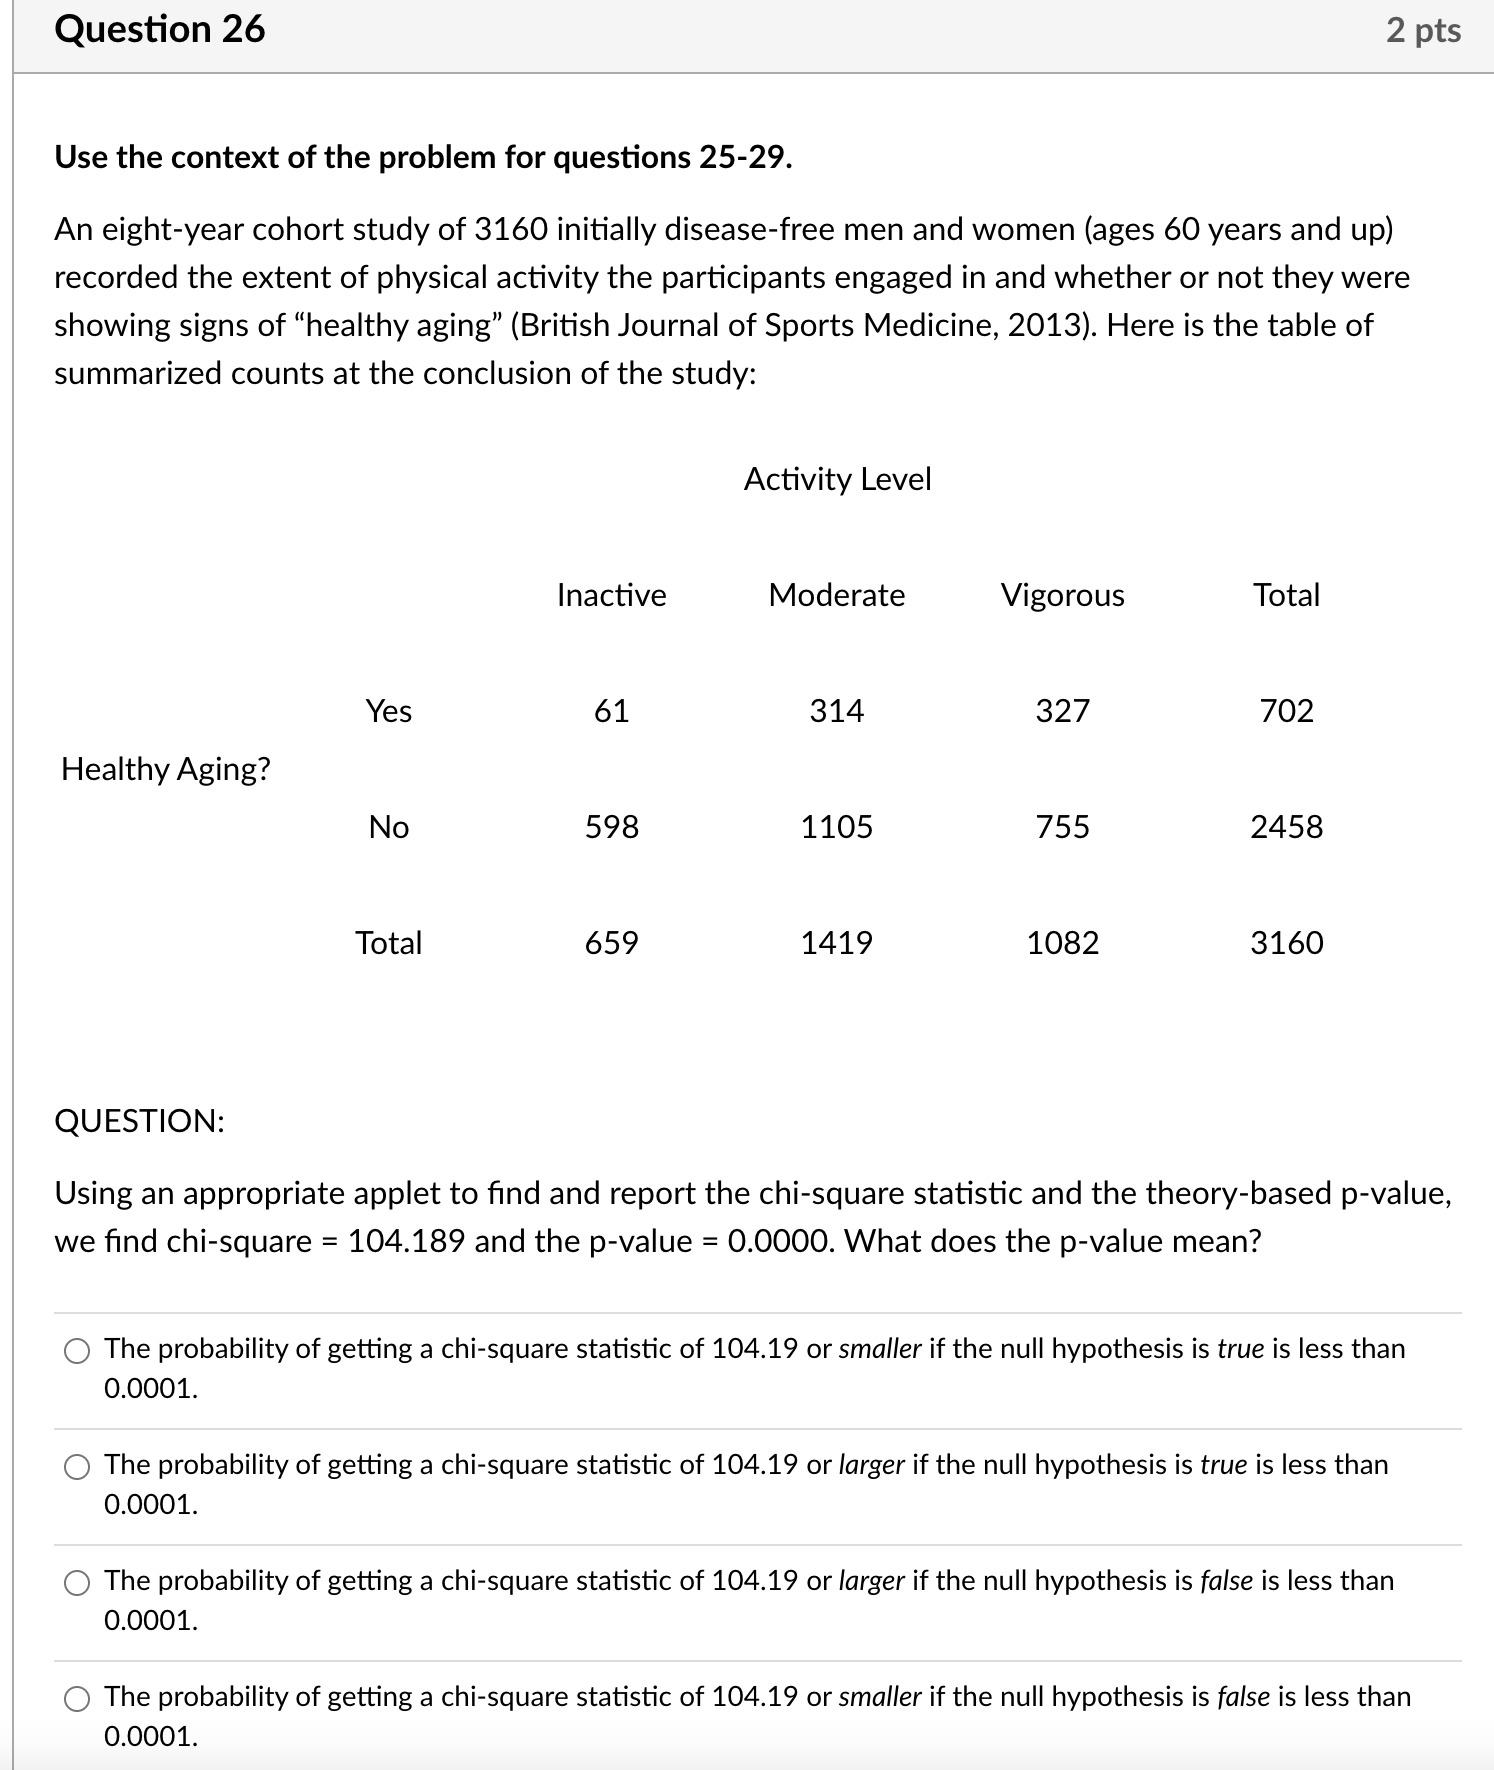
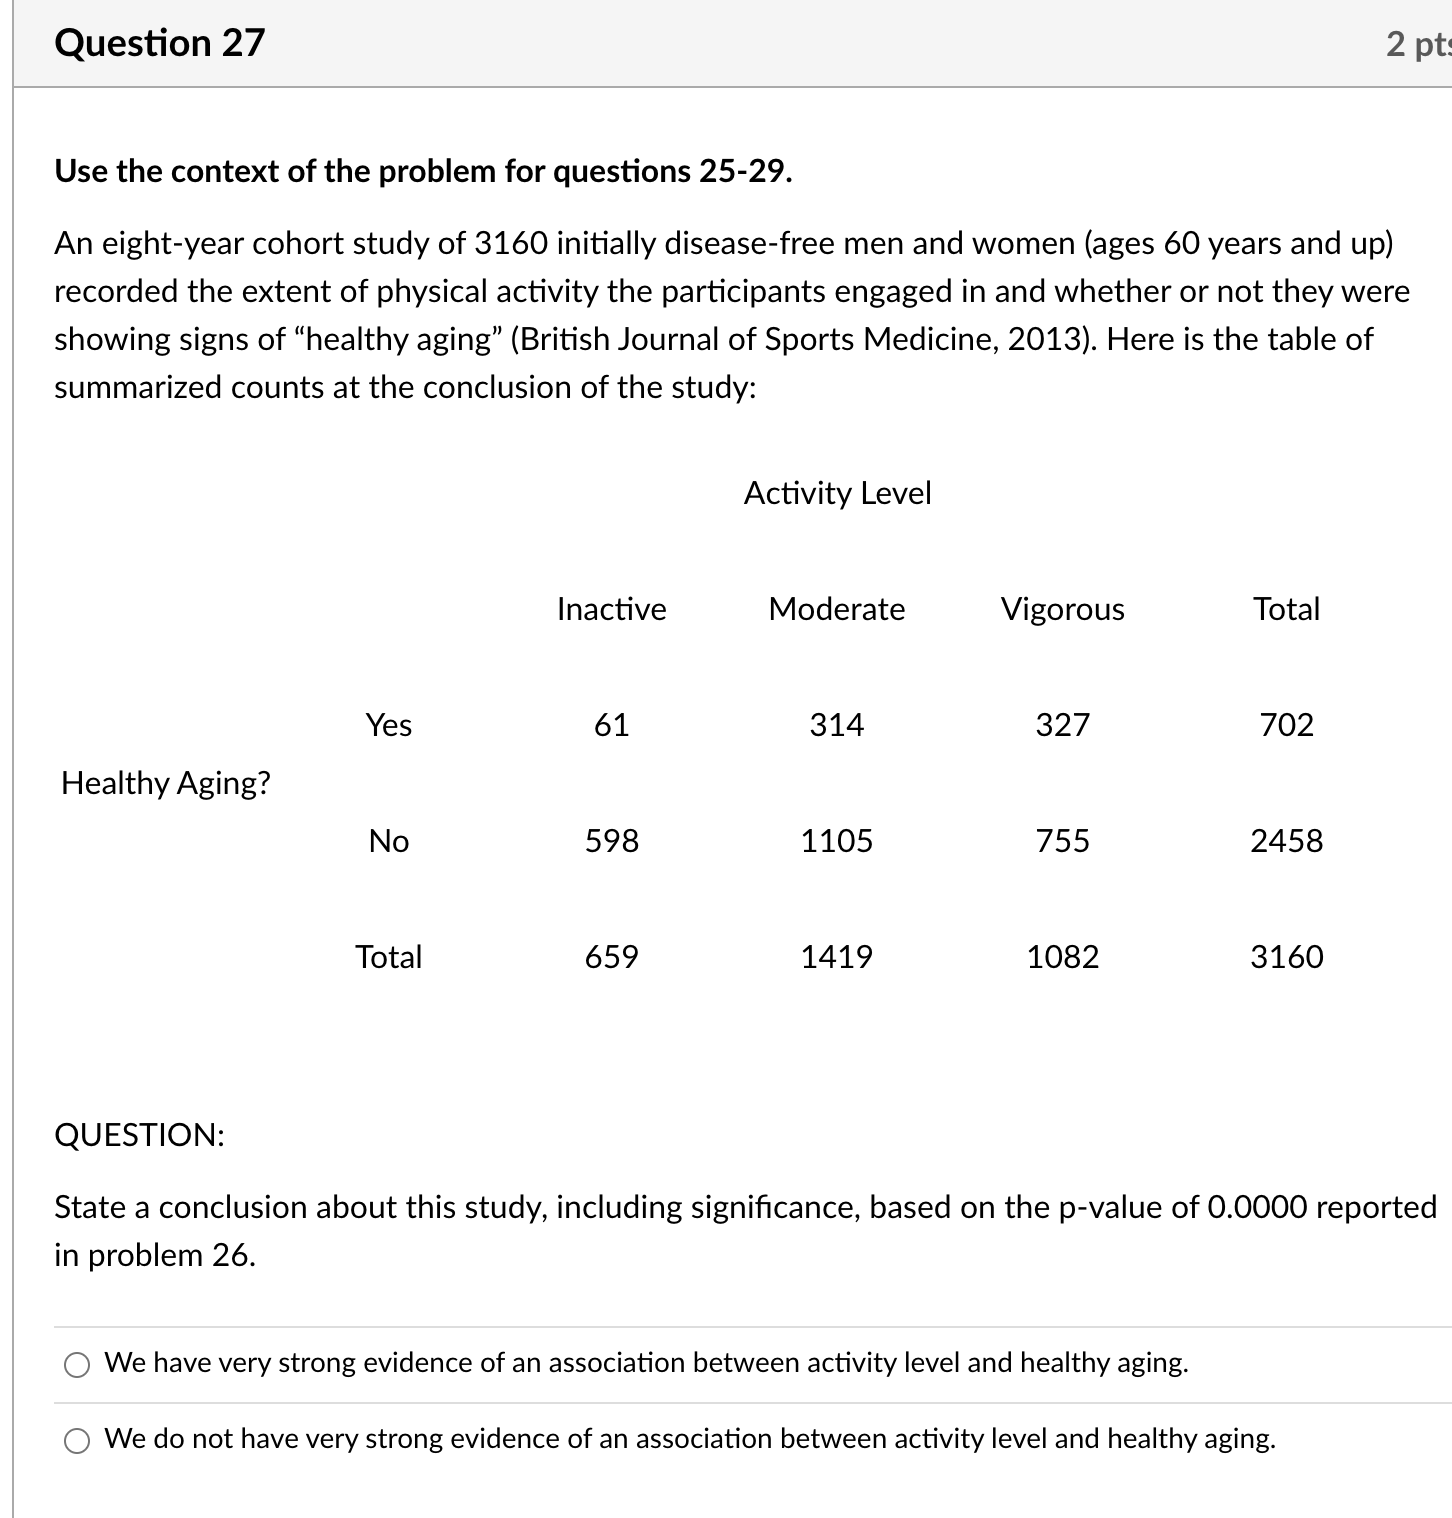
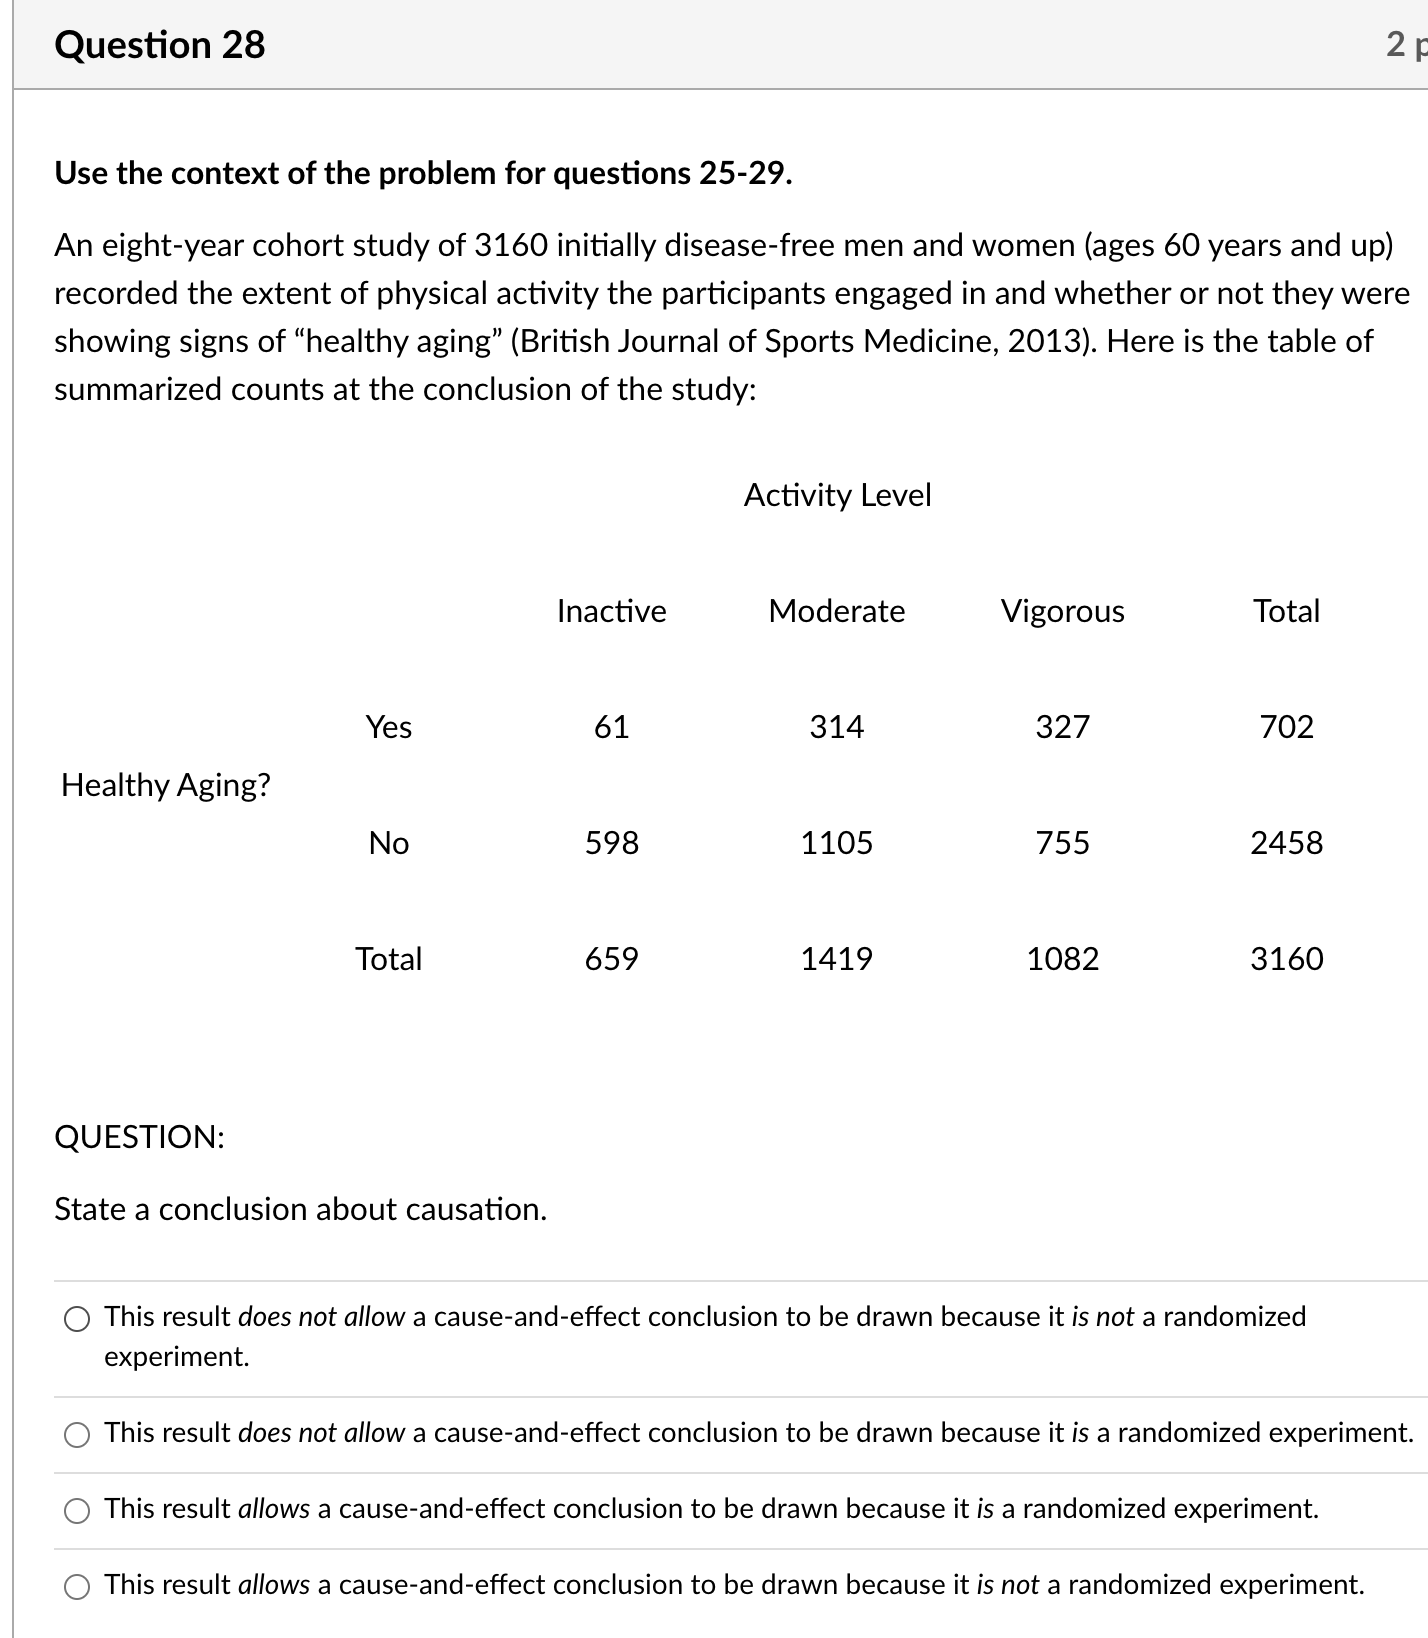
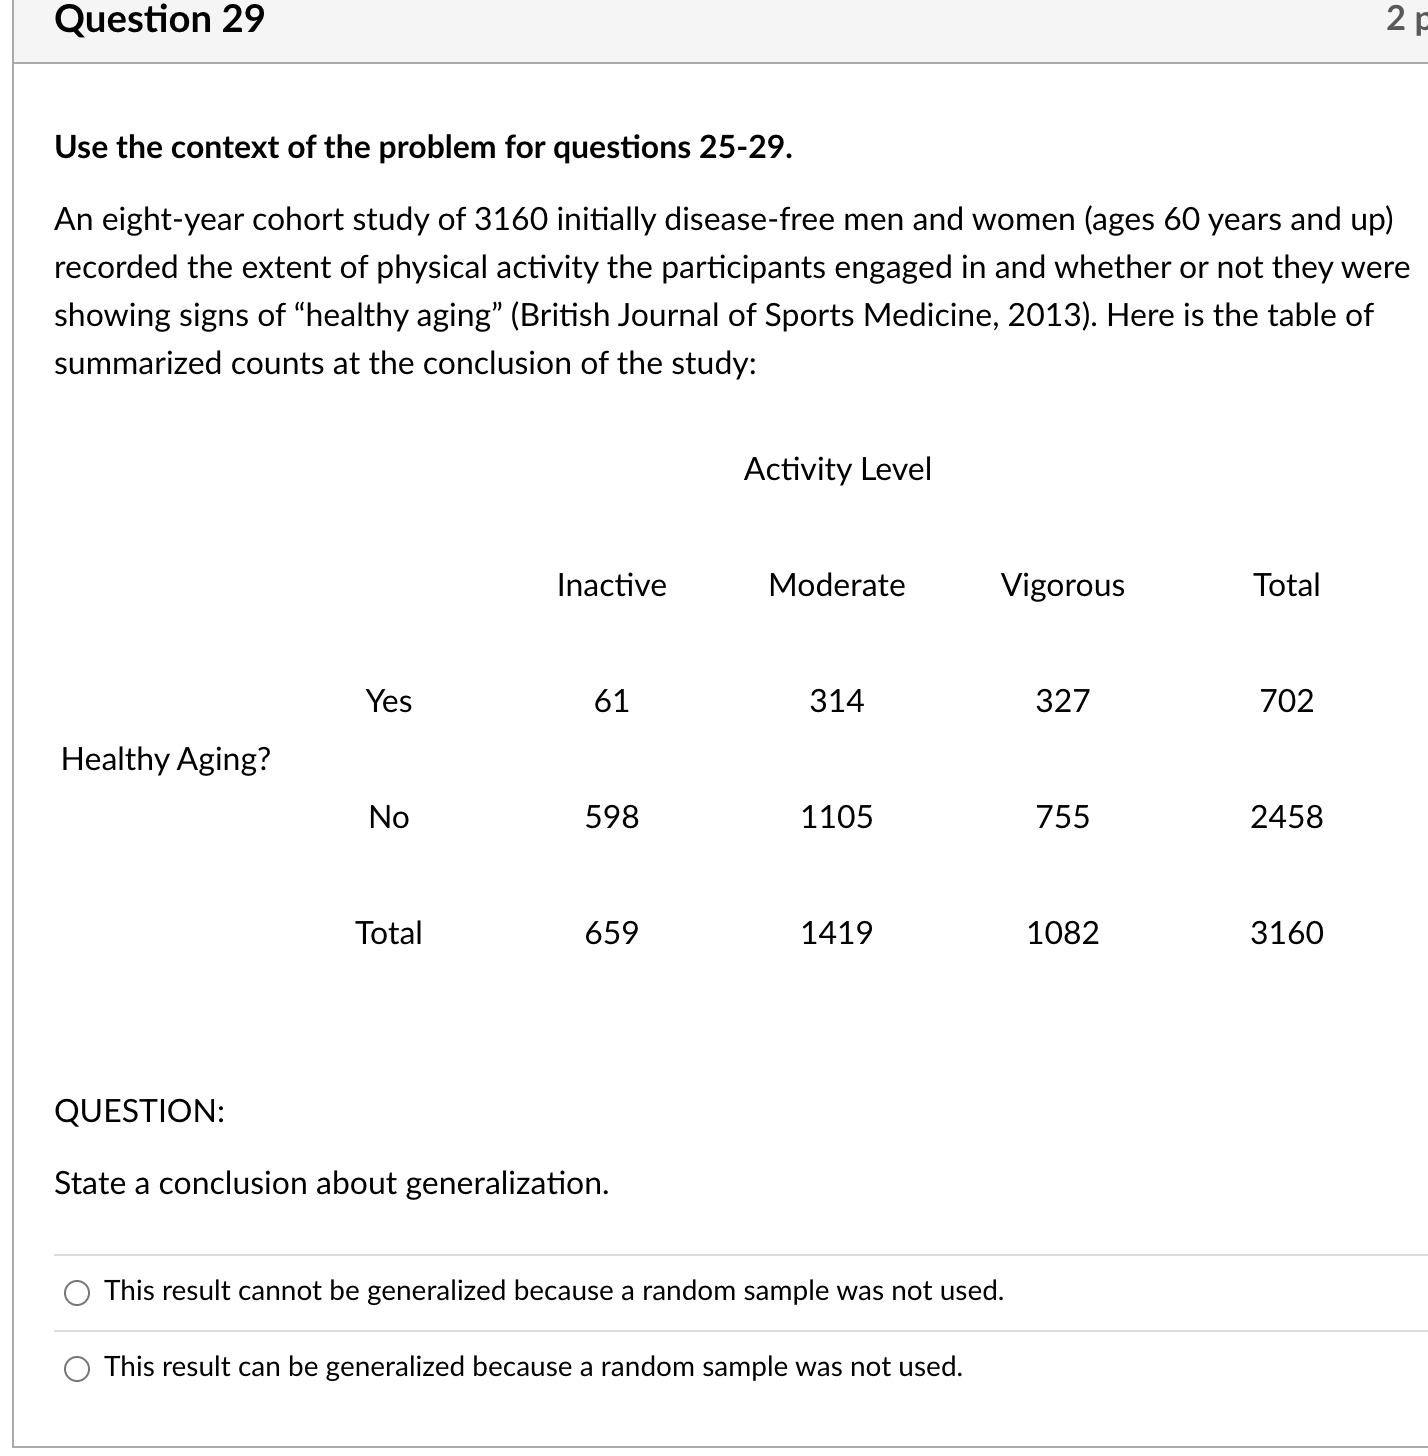
Question 25 2 p1 Use the context of the problem for questions 25-29. An eight-year cohort study of 3160 initially disease-free men and women (ages 60 years and up) recorded the extent of physical activity the participants engaged in and whether or not they were showing signs of \"healthy aging\" (British Journal of Sports Medicine, 2013). Here is the table of summarized counts at the conclusion of the study: Activity Level Inactive Moderate Vigorous Total Yes 61 314 327 702 Healthy Aging? No 598 1105 755 2458 Total 659 1419 1082 3160 QUESTION: Would it be appropriate to use a theory-based method to nd a p-value for this study? 0 Yes, a theory-based method would be appropriate. 0 No, a theory-based method would not be appropriate. Question 26 2 pts Use the context of the problem for questions 25-29. An eight-year cohort study of 3160 initially disease-free men and women (ages 60 years and up) recorded the extent of physical activity the participants engaged in and whether or not they were showing signs of \"healthy aging\" (British Journal of Sports Medicine, 2013). Here is the table of summarized counts at the conclusion of the study: Activity Level Inactive Moderate Vigorous Total Yes 61 314 327 702 Healthy Aging? No 598 1105 755 2458 Total 659 1419 1082 3160 QUESTION: Using an appropriate applet to nd and report the chi-square statistic and the theory-based p-value, we nd chi-square = 104.189 and the p-value = 0.0000. What does the p-value mean? 0 The probability of getting a chi-square statistic of 104.19 or smaller if the null hypothesis is true is less than 0.0001. 0 The probability of getting a chi-square statistic of 104.19 or larger if the null hypothesis is true is less than 0.0001. 0 The probability of getting a chi-square statistic of 104.19 or larger if the null hypothesis is false is less than 0.0001. 0 The probability of getting a chi-square statistic of 104.19 or smaller if the null hypothesis is false is less than 0.0001. Question 27 2 pt! Use the context of the problem for questions 25-29. An eight-year cohort study of 3160 initially disease-free men and women (ages 60 years and up) recorded the extent of physical activity the participants engaged in and whether or not they were showing signs of \"healthy aging\" (British Journal of Sports Medicine, 2013). Here is the table of summarized counts at the conclusion of the study: Activity Level Inactive Moderate Vigorous Total Yes 61 314 327 702 Healthy Aging? No 598 1105 755 2458 Total 659 1419 1082 3160 QUESTION: State a conclusion about this study, including signicance, based on the p-value of 0.0000 reported in problem 26. Q We have very strong evidence of an association between activity level and healthy aging. Q We do not have very strong evidence of an association between activity level and healthy aging. Question 28 2 I: Use the context of the problem for questions 25-29. An eight-year cohort study of 3160 initially disease-free men and women (ages 60 years and up) recorded the extent of physical activity the participants engaged in and whether or not they were showing signs of \"healthy aging\" (British Journal of Sports Medicine, 2013). Here is the table of summarized counts at the conclusion of the study: Activity Level Inactive Moderate Vigorous Total Yes 61 314 327 702 Healthy Aging? No 598 1105 755 2458 Total 659 1419 1082 3160 QUESTION: State a conclusion about causation. O This result does not allow a cause-and-ef'fect conclusion to be drawn because it is not a randomized experiment. 0 This result does not allow a cause-and-ef'fect conclusion to be drawn because it is a randomized experiment. 0 This result allows a cause-and-effect conclusion to be drawn because it is a randomized experiment. 0 This result allows a cause-and-effect conclusion to be drawn because it is not a randomized experiment. Question 29 2 I: Use the context of the problem for questions 25-29. An eight-year cohort study of 3160 initially disease-free men and women (ages 60 years and up) recorded the extent of physical activity the participants engaged in and whether or not they were showing signs of \"healthy aging\" (British Journal of Sports Medicine, 2013). Here is the table of summarized counts at the conclusion of the study: Activity Level Inactive Moderate Vigorous Total Yes 61 314 327 702 Healthy Aging? No 598 1105 755 2458 Total 659 1419 1082 3160 QUESTION: State a conclusion about generalization. O This result cannot be generalized because a random sample was not used. 0 This result can be generalized because a random sample was not used
