
 Please check my calculations for the first part, need help with the second part. The options for change in solution X ice table are: -x, -2x, +2x, +x
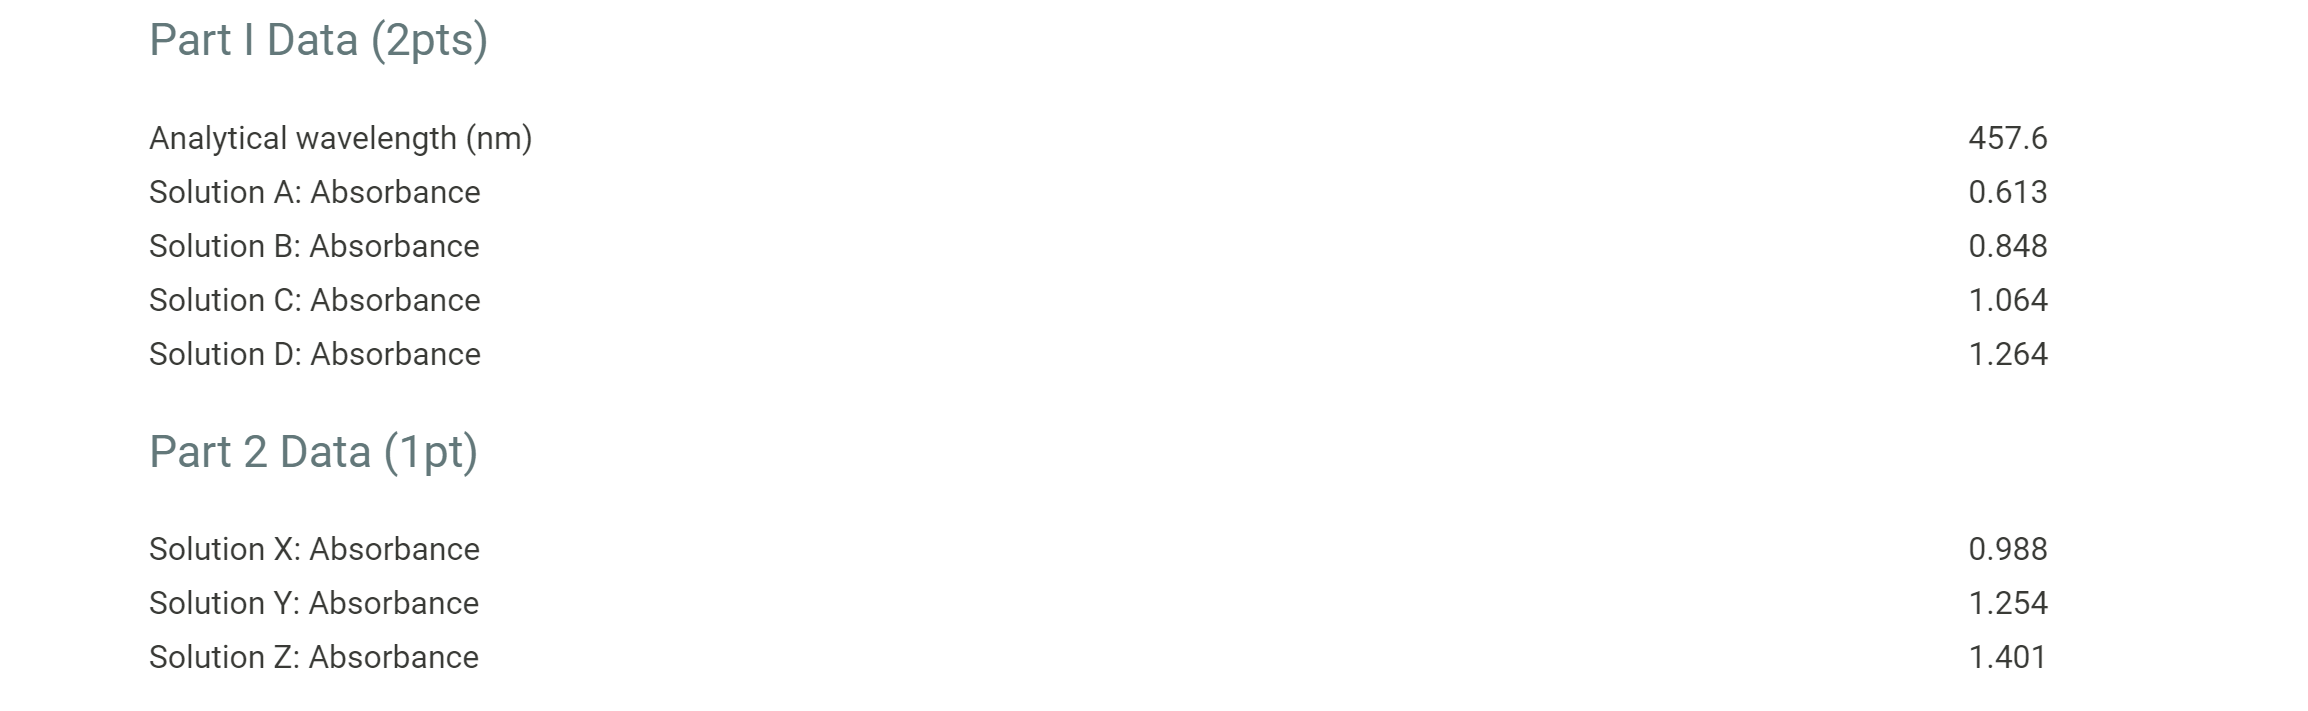
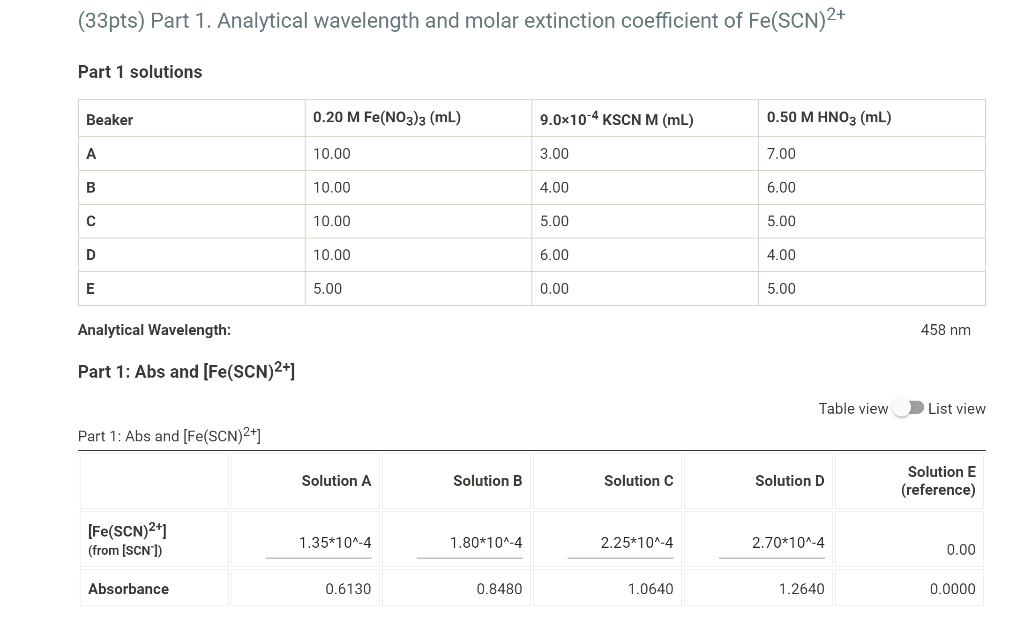
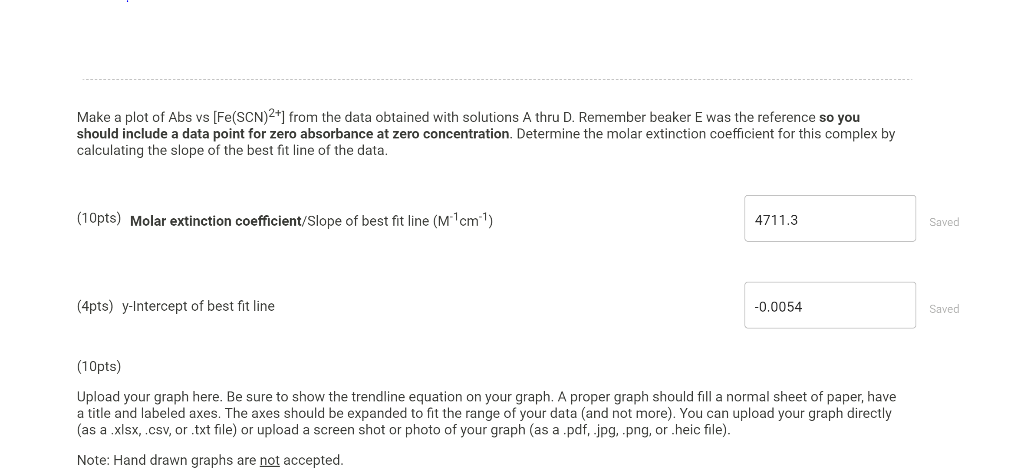
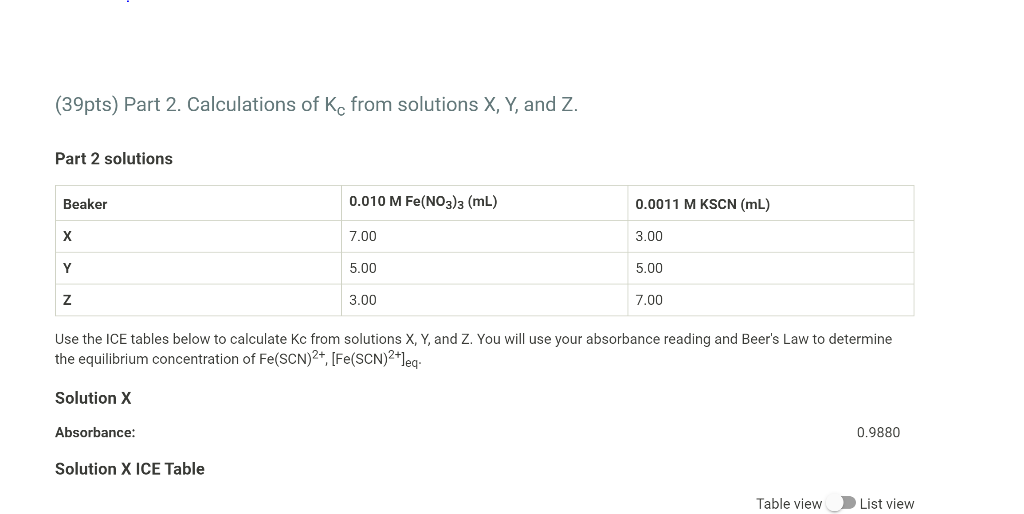
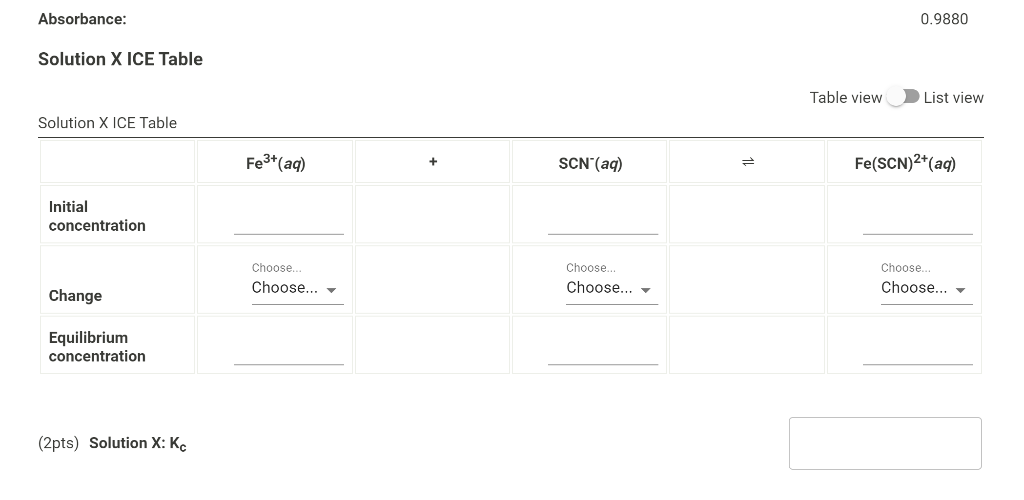
Part I Data (2pts) 457.6 0.613 Analytical wavelength (nm) Solution A: Absorbance Solution B: Absorbance Solution C: Absorbance Solution D: Absorbance 0.848 1.064 1.264 Part 2 Data (1pt) Solution X: Absorbance 0.988 Solution Y: Absorbance 1.254 Solution Z: Absorbance 1.401 (33pts) Part 1. Analytical wavelength and molar extinction coefficient of Fe(SCN)2+ Part 1 solutions Beaker 0.20 M Fe(NO3)3 (mL) 9.0x10⁻⁴ KSCN M (mL) 0.50 M HNO3 (mL) 10.00 3.00 7.00 B 10.00 4.00 6.00 10.00 5.00 5.00 D 10.00 6.00 4.00 E 5.00 0.00 5.00 Analytical Wavelength: 458 nm Part 1: Abs and [Fe(SCN)2+1 Table view List view Part 1: Abs and [Fe(SCN)2+] Solution A Solution B Solution C Solution D Solution E (reference) [Fe(SCN)2+1 (from (SCN']) 1.35*10^-4 1.80*10^-4 2.25*10^-4 2.70*10^-4 0.00 Absorbance 0.6130 0.8480 1.0640 1.2640 0.0000 Make a plot of Abs vs [Fe(SCN)2+] from the data obtained with solutions A thru D. Remember beaker E was the reference so you should include a data point for zero absorbance at zero concentration. Determine the molar extinction coefficient for this complex by calculating the slope of the best fit line of the data. (10pts) Molar extinction coefficient/Slope of best fit line (Micm) 4711.3 Saved (4pts) y-Intercept of best fit line -0.0054 Saved (10pts) Upload your graph here. Be sure to show the trendline equation on your graph. A proper graph should fill a normal sheet of paper, have a title and labeled axes. The axes should be expanded to fit the range of your data and not more). You can upload your graph directly (as a .xlsx, .csv, or .txt file) or upload a screen shot or photo of your graph (as a .pdf, .jpg, png, or heic file). Note: Hand drawn graphs are not accepted. (39pts) Part 2. Calculations of Kc from solutions X, Y, and Z. Part 2 solutions Beaker 0.010 M Fe(NO3)3 (ml) 0.0011 M KSCN (mL) 7.00 3.00 Y 5.00 5.00 Z 3.00 7.00 Use the ICE tables below to calculate Kc from solutions X, Y, and Z. You will use your absorbance reading and Beer's Law to determine the equilibrium concentration of Fe(SCN)2+, [Fe(SCN)2+leg. Solution X Absorbance: 0.9880 Solution X ICE Table Table view List view Absorbance: 0.9880 Solution X ICE Table Table view List view Solution X ICE Table Fe3+ (aq) SCN'(aq) Fe(SCN)2+(aq) Initial concentration Choose... Choose... Choose Choose... Choose Choose... Change Equilibrium concentration (2pts) Solution X: KC 1. Why it is important to use the Part 1 solutions in Part 1 and the Part 2 solutions in Part 2? What would happen if the Part 2 Fe3+ solution was used in Part 1 by mistake? 2. If the cuvette was wet and not properly rinsed before you analyzed your sample, how would that affect the equilibrium constant you would be reporting for that sample