Please code for full - extra credit one as well
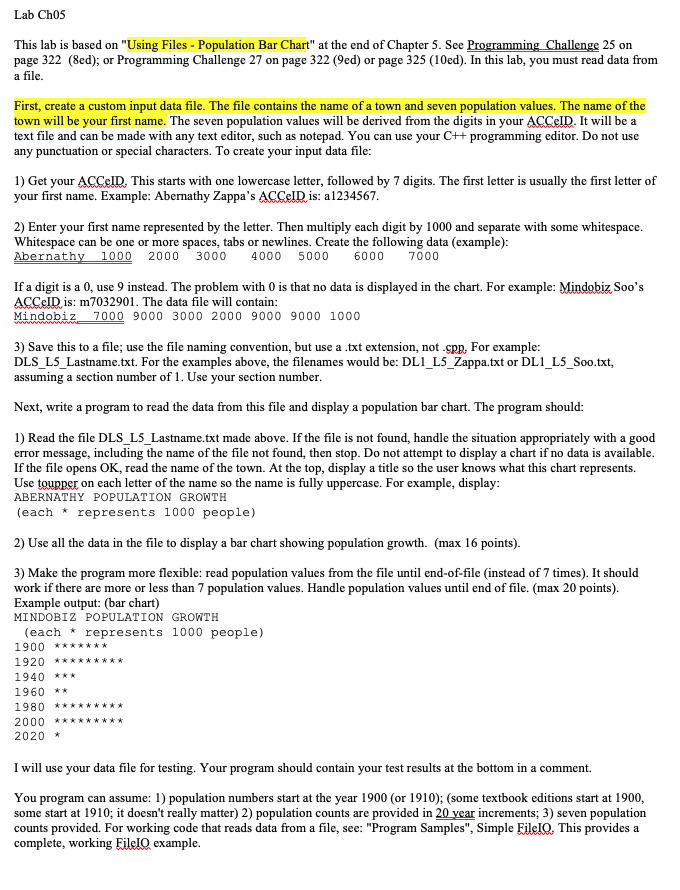
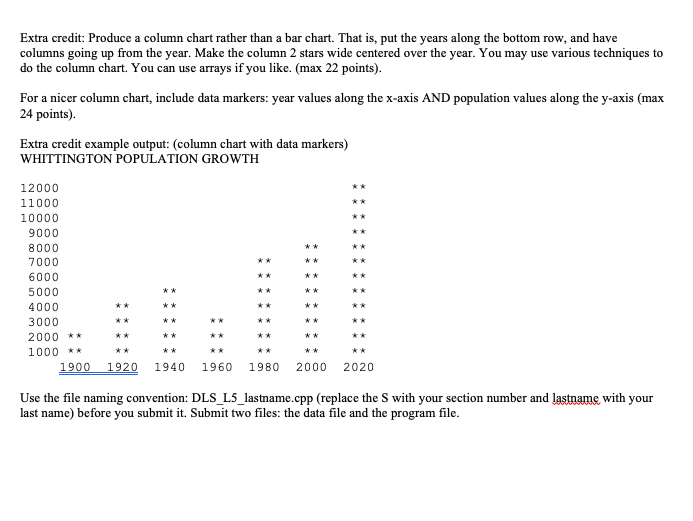
Lab Chos This lab is based on "Using Files - Population Bar Chart" at the end of Chapter 5. See Programming Challenge 25 on page 322 (8ed); or Programming Challenge 27 on page 322 (9ed) or page 325 (10ed). In this lab, you must read data from a file. First, create a custom input data file. The file contains the name of a town and seven population values. The name of the town will be your first name. The seven population values will be derived from the digits in your ACCID. It will be a text file and can be made with any text editor, such as notepad. You can use your C++ programming editor. Do not use any punctuation or special characters. To create your input data file: 1) Get your ACCEID. This starts with one lowercase letter, followed by 7 digits. The first letter is usually the first letter of your first name. Example: Abernathy Zappa's ACCID is: a1234567. 2) Enter your first name represented by the letter. Then multiply each digit by 1000 and separate with some whitespace. Whitespace can be one or more spaces, tabs or newlines. Create the following data (example): Abernathy 1000 2000 3000 4000 5000 6000 7000 If a digit is a 0, use 9 instead. The problem with O is that no data is displayed in the chart. For example: Mindobiz Soo's ACCeID is: m7032901. The data file will contain: Mindobiz 7000 9000 3000 2000 9000 9000 1000 3) Save this to a file; use the file naming convention, but use a .txt extension, not.cpp, For example: DLS_L5_Lastname.txt. For the examples above, the filenames would be: DL1_L5_Zappa.txt or DL1_L5_Soo.txt, assuming a section number of 1. Use your section number. Next, write a program to read the data from this file and display a population bar chart. The program should: 1) Read the file DLS_L5_Lastname.txt made above. If the file is not found, handle the situation appropriately with a good error message, including the name of the file not found, then stop. Do not attempt to display a chart if no data is available. If the file opens OK, read the name of the town. At the top, display a title so the user knows what this chart represents. Use toupper on each letter of the name so the name is fully uppercase. For example, display: ABERNATHY POPULATION GROWTH (each * represents 1000 people) 2) Use all the data in the file to display a bar chart showing population growth. (max 16 points). 3) Make the program more flexible: read population values from the file until end-of-file (instead of 7 times). It should work if there are more or less than 7 population values. Handle population values until end of file. (max 20 points). Example output: (bar chart) MINDOBIZ POPULATION GROWTH (each * represents 1000 people) 1900 ******* 1920 ********* 1940 *** 1960 ** 1980 ********* 2000 ***** 2020 * I will use your data file for testing. Your program should contain your test results at the bottom in a comment. You program can assume: 1) population numbers start at the year 1900 (or 1910); (some textbook editions start at 1900, some start at 1910; it doesn't really matter) 2) population counts are provided in 20 year increments; 3) seven population counts provided. For working code that reads data from a file, see: "Program Samples", Simple Filelo. This provides a complete, working File10 example. Extra credit: Produce a column chart rather than a bar chart. That is, put the years along the bottom row, and have columns going up from the year. Make the column 2 stars wide centered over the year. You may use various techniques to do the column chart. You can use arrays if you like. (max 22 points). For a nicer column chart, include data markers: year values along the x-axis AND population values along the y-axis (max 24 points) Extra credit example output: (column chart with data markers) WHITTINGTON POPULATION GROWTH 12000 11000 10000 9000 8000 7000 6000 5000 4000 3000 2000 ** 1000 ** 1900 1920 1940 1960 1980 2000 2020 your Use the file naming convention: DLS_L5_lastname.cpp (replace the S with your section number and lastname with last name) before you submit it. Submit two files: the data file and the program file. Lab Chos This lab is based on "Using Files - Population Bar Chart" at the end of Chapter 5. See Programming Challenge 25 on page 322 (8ed); or Programming Challenge 27 on page 322 (9ed) or page 325 (10ed). In this lab, you must read data from a file. First, create a custom input data file. The file contains the name of a town and seven population values. The name of the town will be your first name. The seven population values will be derived from the digits in your ACCID. It will be a text file and can be made with any text editor, such as notepad. You can use your C++ programming editor. Do not use any punctuation or special characters. To create your input data file: 1) Get your ACCEID. This starts with one lowercase letter, followed by 7 digits. The first letter is usually the first letter of your first name. Example: Abernathy Zappa's ACCID is: a1234567. 2) Enter your first name represented by the letter. Then multiply each digit by 1000 and separate with some whitespace. Whitespace can be one or more spaces, tabs or newlines. Create the following data (example): Abernathy 1000 2000 3000 4000 5000 6000 7000 If a digit is a 0, use 9 instead. The problem with O is that no data is displayed in the chart. For example: Mindobiz Soo's ACCeID is: m7032901. The data file will contain: Mindobiz 7000 9000 3000 2000 9000 9000 1000 3) Save this to a file; use the file naming convention, but use a .txt extension, not.cpp, For example: DLS_L5_Lastname.txt. For the examples above, the filenames would be: DL1_L5_Zappa.txt or DL1_L5_Soo.txt, assuming a section number of 1. Use your section number. Next, write a program to read the data from this file and display a population bar chart. The program should: 1) Read the file DLS_L5_Lastname.txt made above. If the file is not found, handle the situation appropriately with a good error message, including the name of the file not found, then stop. Do not attempt to display a chart if no data is available. If the file opens OK, read the name of the town. At the top, display a title so the user knows what this chart represents. Use toupper on each letter of the name so the name is fully uppercase. For example, display: ABERNATHY POPULATION GROWTH (each * represents 1000 people) 2) Use all the data in the file to display a bar chart showing population growth. (max 16 points). 3) Make the program more flexible: read population values from the file until end-of-file (instead of 7 times). It should work if there are more or less than 7 population values. Handle population values until end of file. (max 20 points). Example output: (bar chart) MINDOBIZ POPULATION GROWTH (each * represents 1000 people) 1900 ******* 1920 ********* 1940 *** 1960 ** 1980 ********* 2000 ***** 2020 * I will use your data file for testing. Your program should contain your test results at the bottom in a comment. You program can assume: 1) population numbers start at the year 1900 (or 1910); (some textbook editions start at 1900, some start at 1910; it doesn't really matter) 2) population counts are provided in 20 year increments; 3) seven population counts provided. For working code that reads data from a file, see: "Program Samples", Simple Filelo. This provides a complete, working File10 example. Extra credit: Produce a column chart rather than a bar chart. That is, put the years along the bottom row, and have columns going up from the year. Make the column 2 stars wide centered over the year. You may use various techniques to do the column chart. You can use arrays if you like. (max 22 points). For a nicer column chart, include data markers: year values along the x-axis AND population values along the y-axis (max 24 points) Extra credit example output: (column chart with data markers) WHITTINGTON POPULATION GROWTH 12000 11000 10000 9000 8000 7000 6000 5000 4000 3000 2000 ** 1000 ** 1900 1920 1940 1960 1980 2000 2020 your Use the file naming convention: DLS_L5_lastname.cpp (replace the S with your section number and lastname with last name) before you submit it. Submit two files: the data file and the program file