Answered step by step
Verified Expert Solution
Link Copied!

Question

1 Approved Answer

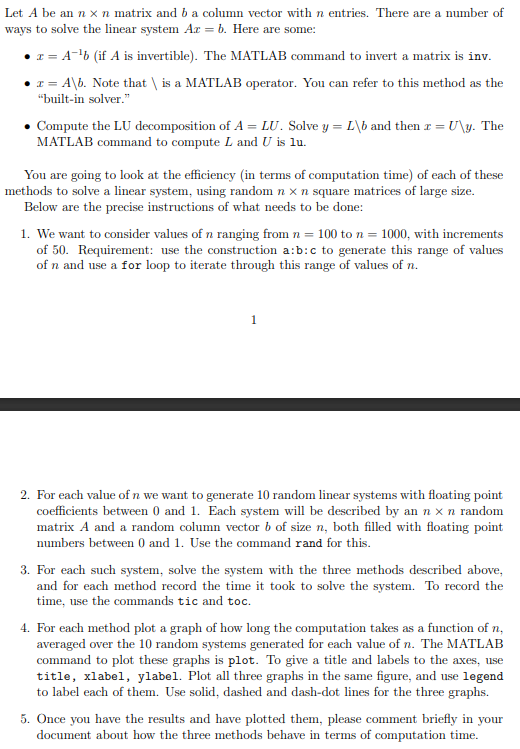
Please Code in Matlab Let A be an n x n matrix and b a column vector with n entries. There are a number of

Please Code in Matlab

image text in transcribed

Let A be an n x n matrix and b a column vector with n entries. There are a number of ways to solve the linear system Ac = b. Here are some: I = A-1 (if A is invertible). The MATLAB command to invert a matrix is inv. I =A\6. Note that is a MATLAB operator. You can refer to this method as the "built-in solver." Compute the LU decomposition of A=LU. Solve y = L\b and then r = U\y. The MATLAB command to compute L and U is lu. You are going to look at the efficiency in terms of computation time) of each of these methods to solve a linear system, using random n x n square matrices of large size. Below are the precise instructions of what needs to be done: 1. We want to consider values of n ranging from n = 100 to n = 1000, with increments of 50. Requirement: use the construction a:b:c to generate this range of values of n and use a for loop to iterate through this range of values of n. 1 2. For each value of n we want to generate 10 random linear systems with floating point coefficients between 0 and 1. Each system will be described by an n x n random matrix A and a random column vector b of size n, both filled with floating point numbers between 0 and 1. Use the command rand for this. 3. For each such system, solve the system with the three methods described above, and for each method record the time it took to solve the system. To record the time, use the commands tic and toc. 4. For each method plot a graph of how long the computation takes as a function of n, averaged over the 10 random systems generated for each value of n. The MATLAB command to plot these graphs is plot. To give a title and labels to the axes, use title, xlabel, ylabel. Plot all three graphs in the same figure, and use legend to label each of them. Use solid, dashed and dash-dot lines for the three graphs. 5. Once you have the results and have plotted them, please comment briefly in your document about how the three methods behave in terms of computation time

Step by Step Solution

There are 3 Steps involved in it

Step: 1

blur-text-image

Get Instant Access to Expert-Tailored Solutions

See step-by-step solutions with expert insights and AI powered tools for academic success

Step: 2

blur-text-image

Step: 3

blur-text-image

Ace Your Homework with AI

Get the answers you need in no time with our AI-driven, step-by-step assistance

Get Started

Recommended Textbook for

Professional SQL Server 2012 Internals And Troubleshooting

Authors: Christian Bolton, Justin Langford

1st Edition

1118177657, 9781118177655

More Books

Students also viewed these Databases questions

Question

List and describe the security control weaknesses at TJX Companies.

Answered: 1 week ago

Question

What is the Definition for Third Normal Form?

Answered: 1 week ago

Question

Provide two examples of a One-To-Many relationship.

Answered: 1 week ago