Answered step by step
Verified Expert Solution
Question
1 Approved Answer
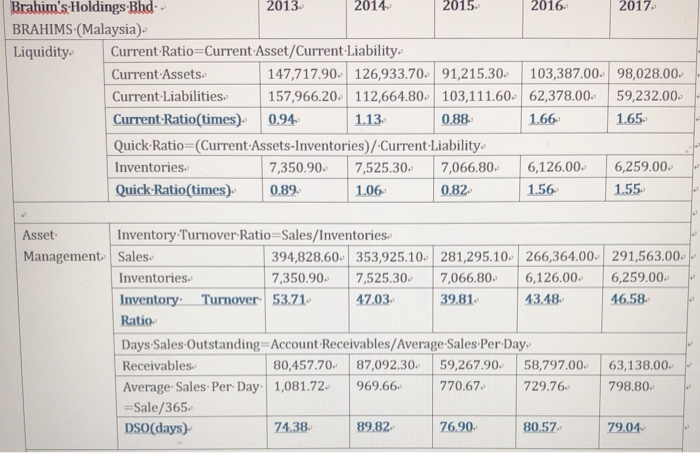
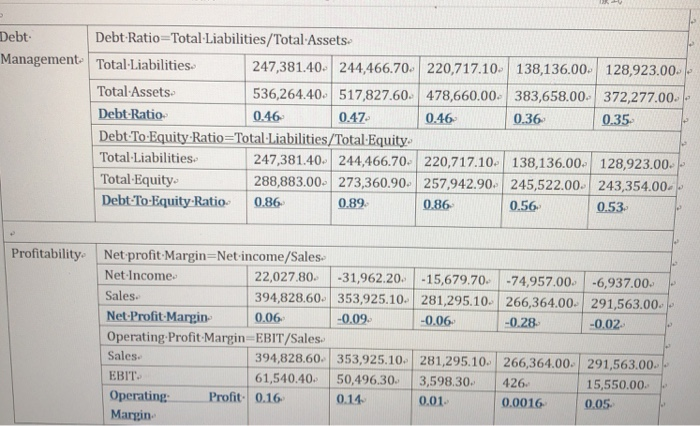
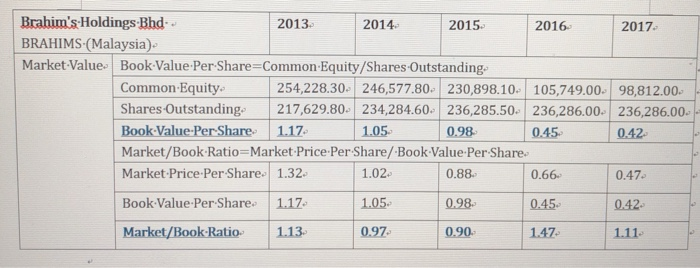
Please compare fives years ratio and analysis each ratio which is better and reason. Brahim's Holdings Bhd. 2013 2014 2015 2016 2017 BRAHIMS (Malaysia) Liquidity
Please compare fives years ratio and analysis each ratio which is better and reason. 


Brahim's Holdings Bhd. 2013 2014 2015 2016 2017 BRAHIMS (Malaysia) Liquidity Current Ratio-Current Asset/Current Liability. Current Assets 147,717.90 126,933.70 91,215.30 103,387.00 98,028.00 157,966.20 112,664.80 103,111.60 62,378.00 59,232.00 Current Liabilities Current-Ratio(times) 094 Quick-Ratio (Current Assets-Inventories)/Current Liability 1.13 0.88 1.66 1.65 Inventories 7,350.90 7,525.30 7,066.806,126.00 6,259.00 Quick-Ratio(times 0.89 1.06 0.82 1.56 1.55 Asset Inventory Turnover Ratio-Sales/Inventories 394,828.60 353,925.10 281,295.10 266,364.00 291,563.00 7,350.90 7,525.30 7,066.80 6,126.00 6,259.00 Management. Sales Inventories Inventory Turnover 53.71. 47.03 39.81 43.4846.58 Ratio Days Sales Outstanding Account Receivables/Average Sales Per Day. Receivables 80,457.70 87,092.30 59,267.90 58,797.0063,138.00 Average Sales Per Day 1,081.72 969.66 770.67 729.76 798.80 Sale/365 DSO (days) 74.38 89.82 7690 80.57 79.04 Debt Debt Ratio-Total Liabilities/Total Assets Total lalite 247.38140. 244,4670 20717.10 13813600. 128923.00 Total-Assets Debt-Ratio Debt To Equity Ratio Total Liabilities/Total Equity 536,264.40 517827.60 478,660.00 383,658.00 372,277.00 046 047 060.36035 0.46 0.35. Total Liabilities 247,3814044466.70. 220,717.10. 138,136.00. 128,923.00. Total-Liabilities Total Equity Debt To-Equity-Ratio 288,883.00. 273360.90 257 942.90. 245,522.00. 243,354.00 0.86 089 0.86 0.56 0.53 Profitability Net profit Margin-Net income/Sales 22,027 80 -31,962.20 -15,679.70. -74957.00 6937.00 Net Income Sales. Net Profit Margin Operating Profit Margin EBIT/Sales Sales EBIT Operating Margin 394,828.60 353,925.10 281,295.10 266,364.00 291,563.00 0.06 0.09 0.06 -0.28 0.02 94,828.60. 353,925.10 281,295.10 266,364.00 291,563.00 61,540.40 50,496.30 3,598.30 426 5,550.00 Profit-0.16 0.14 0.01 0.0016 005 Brahim's Holdings Bhd BRAHIMS (Malaysia) Market Value Book Value Per Share-Common Equity/Shares Outstanding. 2013 2014 2015 2016 2017 254,228.30 246,577.80 230,898.10 105,749.00 98,812.00 Common Equity Shares Outstanding 217,629.80 234,284.60 236,285.50 236,286.00 Book-Value Per Share 1.17 Market/Book Ratio- Market Price-Per-Share/Book Value Per Share Market Price Per Share. 1.32 Book-Value-PerShare.' | L17. Market/Book-Ratio- IL13- 236,286.00. 1.05 1.02 1.05 0.98 0.45042 0.66 0.45. Per-Share/-Book-Value-Per-Share 0.88 0.98. 0.90 0.47 042 1147-141- 097 


Step by Step Solution
There are 3 Steps involved in it
Step: 1

Get Instant Access to Expert-Tailored Solutions
See step-by-step solutions with expert insights and AI powered tools for academic success
Step: 2

Step: 3

Ace Your Homework with AI
Get the answers you need in no time with our AI-driven, step-by-step assistance
Get Started


