Please compare the company ratios to the Industry. How is the company being managed relative to the average firm?
Include whether they are doing better or worse relative to the Industry and why. - I am having a hard time comparing and understand this data.
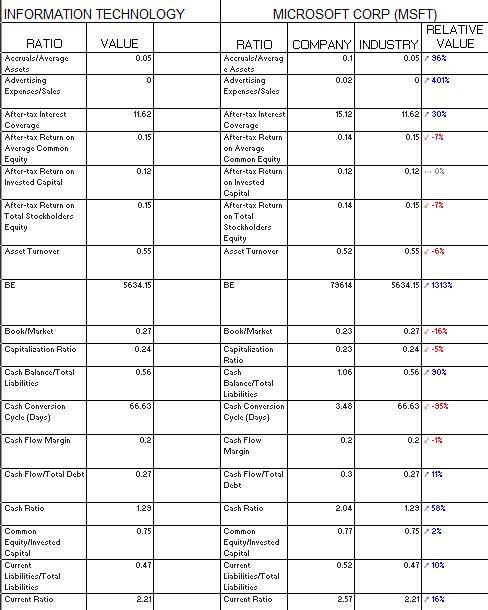
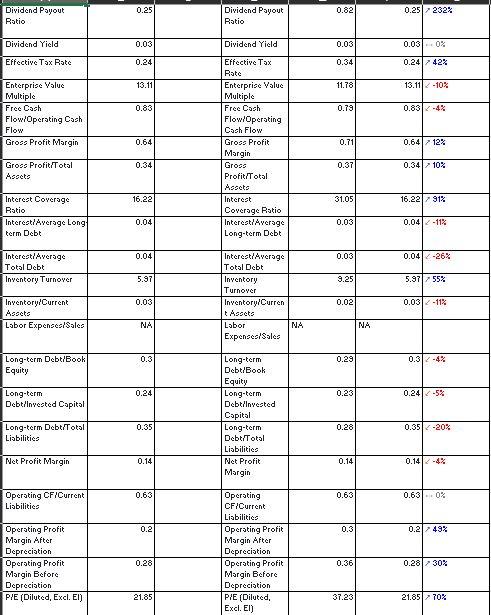
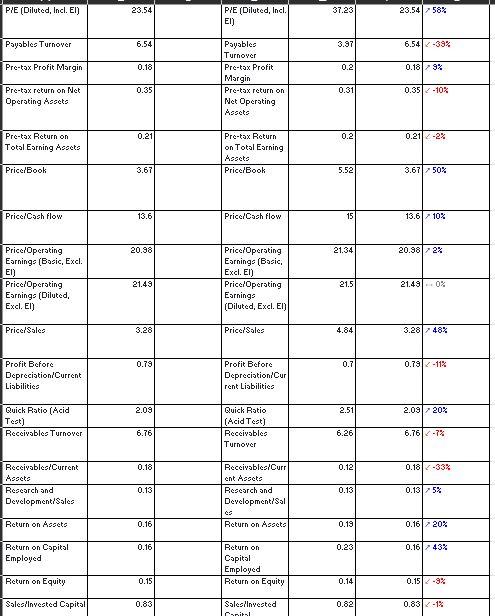
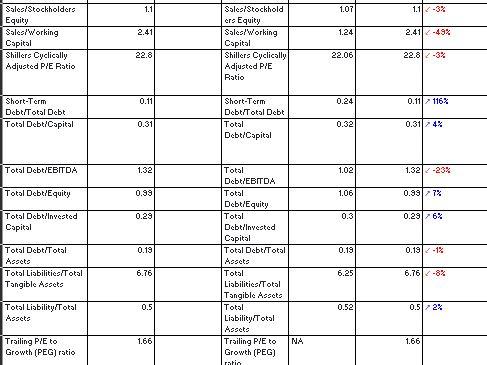
INFORMATION TECHNOLOGY VALUE 0.05 RATIO Accruals/Average Asseto Advertising Expenses/Sales MICROSOFT CORP (MSFT) RELATIVE RATIO COMPANY INDUSTRY VALUE AccruallAverag 0.1 0.051 36% Assets Advertising 0.02 01 401% Expenses/Sales 0 11.62 15.12 11.62 30% 0.15 0.14 0.15-7% After-tax Interest Coverage After-tax Return on Average Common Equity After-tox Return on Invested Capital 0.12 0.12 0.12.0% After-tax Interest Coverage After-tax Return on Average Common Equity After-tax Return on Invested Capital After-tax Return on Total Stockholders Equity Asset Turnover 0.15 0.14 0.151 -7% After-tax Return on Total Stockholders Equity Asset Turnover 0.551 0.52 0.55 -6% BE 5634.15 BE 79614 5634.15 1313% Book/Market 0.27 Book Market 0.23 0.27 -16% Capitalization Ratio 0.24 0.23 0.2412 -5% 0.56 1.06 0.56 - 90% Cash Balance/Total Liabilities Capitalization Ratio Cash Balance/Total Liabilities Cash Conversion Cycle (Days) 66.63 3.48 66.63-95% Cash Conversion Cycle (Days) Cash Flow Margin 0.2 0.2 0.22-12 Cash Flow Margin Cash Flow/Total Debt 0.27 0.3 0.27 11% Cash Flow/Total Debt Cash Ratio 1.29 Cash Ratio 2.04 1.2958% 0.75 0.77 0.751 - 2% Common Equity/Invested Capital Current Liabilities/Total Liabilities Current Ratio 0.47 Common Equity/Invested Capital Current Liabilitica/Total Liabilities Current Ratio 0.52 0.47 10% 2.21 2.57 2.211 16% 0.25 0.82 0.25 - 232% Dividend Payout Ratio Dividend Payout Ratio Dividend Yield 0.03 Dividend Yield 0.03 0.03-02 Effective Tax Rate 0.24 0.34 0.24 42% 13.11 11.78 13.11 -10% 0.83 0.79 0.83 -4% Enterprise Value Multiple Free Cach Flow/Operating Cash Flow Gross Profit Margin 0.64 0.71 0.64 12% Effective Tax Rate Enterprise Value Multiple Free Cach Flow/Operating Cash Flow Gross Profit Margin Gross Profit/Total Assets Interest Coverage Ratio Interest/Average Long-term Debt 0.34 0.37 0.341 - 10% Gross Profit/Total Assets 16.22 31.05 16.22 / 912 Interest Coverage Ratio Interest/Average Long term Debt 0.04 0.03 0.04-11% 0.04 0.03 0.04-26% Interest/Average Total Debt Inventory Turnover 5.97 9.25 5.971 55% Interest/Average Total Debt Inventory Turnover Inventory/Curren tAsseto 0.03 0.02 0.03 - 11% Inventory/Current Assets Labor Expence Sales NA Labor NA NA Expenses/Sales 0.3 0.29 0.312-4% Long-term Debt/Book Equity 0.24 0.23 0.241 -5% Long-term Debt/Invested Capital Long-term Debt/Book Equity Long-term Debt/Invested Capital Long-term Debt/Total Liabilities Net Profit Margin 0.35 0.28 Long-term Debt/Total Liabilities 0.351 -20% Net Profit Margin 0.14 0.14 0.142-43 0.63 0.63 0.63 -0% Operating CF/Current Liabilities | 0.2 0.3 0.21 49% Operating Profit Margin Alter Depreciation Operating Profit Margin Before Depreciation PIE (Diluted, Excl. EI) Operating CF/Current Liabilities Operating Profit Margin After Depreciation Operating Profit Margin Before Depreciation PIE (Diluted, Excl. El) 0.28 0.36 0.281-30% 21.85 37.23 21.851 70% PIE (Diluted, Incl. EI) 23.54 37.23 23.54-58% PIE (Diluted, Incl. EI) Payable Turnover 6.54 3.97 6.541 -39% Pre-tax Profit Margin 0.18 0.2 0.181 29% Payables Turnover Pre-tax Profit Margin Pre-tax return on Net Operating Assets 0.35 0.311 0.35-10% Pre-tax return on Net Operating Assets 0.21 0.2 0.211-2% Pre-tax Return on Total Earning Assets Pre-tax Return on Total Earning | Assets Price/Book PriceBook 3.67 5.52 3.671-50% Price/Cash flow 13.6 PricelCash flow 15 13.6 - 10% 20.98 21.34 20.382% Price/Operating Earnings (Basic, Excl. ) Price/Operating Earnings (Diluted, Excl. EI) 21.49 Price/Operating Earning: (Basic, Excl. EI) Price/Operating Earnings (Diluted, Excl. EI) 21.5 21.490% Price/Sales 3.28 Price/Sales 4.84 3.28 - 48% 0.79 0.7 0.791 -11% Profit Before Depreciation Current Liabilities Profit Before Depreciation/Cur rent Liabilities 2.09 2.51 2.09 20% Quick Ratio (Acid Test) Receivables Turnover Quick Ratio (Acid Test) Receivables Turnover 6.76 6.26 6.761-7% 0.18 0.12 0.18 -33% Receivables/Current Assets Research and Development/Sales 0.13 0.13 0.13|-- 5% Receivables/Curr ent Assets Research and Development/Sal cs Return on Assets Return on Assets 0.16 0.19 0.16 20% 0.16 0.23 0.162 43% Return on Capital Employed Return on Capital Employed Return on Equity Return on Equity 0.15 0.14 0.15 Sales/Invested Capital 0.83 SaleslInvested Initi 0.82 0.83 -1% 1.1 1.07 1.11-3% 2.41 1.24 2.41-43% Sales/Stockholders Equity Sales/Working Capital Shillero Cyclically Adjusted P/E Ratio Salco/Stockhold ers Equity Sales/Working Capital Shillers Cyclically Adjusted P/E Ratio 22.8 22.06 22.8 -3% 0.11 0.24 0.11 - 116% Short-Tarm Debt/Total Debt Total Debt/Capital Short-Term DebtTotal Debt Total Debt/Capital 0.31 0.32 0.31 - 4% Total Debt/EBITDA 1.32 1.02 1.321-23% Total Debt/Equity 0.99 1.06 0.99 7% 0.29 0.3 0.29 -6% Total Debt/Invested Capital 0.19 0.13 0.19-13 Total Debt/Total Assets Total Liabilities/Total Tangible Assets Total Debt/EBITDA Total Debt/Equity Total Debt/Invested Capital Total Debt/Total Assets Total Liabilities/Total Tangible Asseto Total Liability/Total Assets Trailing P/E to Growth (PEG) ratio 6.76 6.25 6.761-83 0.5 0.52 Total Liability/Total Assets 0.52% 1.66 NA 1.66 Trailing P/E to Growth (PEG) ratio INFORMATION TECHNOLOGY VALUE 0.05 RATIO Accruals/Average Asseto Advertising Expenses/Sales MICROSOFT CORP (MSFT) RELATIVE RATIO COMPANY INDUSTRY VALUE AccruallAverag 0.1 0.051 36% Assets Advertising 0.02 01 401% Expenses/Sales 0 11.62 15.12 11.62 30% 0.15 0.14 0.15-7% After-tax Interest Coverage After-tax Return on Average Common Equity After-tox Return on Invested Capital 0.12 0.12 0.12.0% After-tax Interest Coverage After-tax Return on Average Common Equity After-tax Return on Invested Capital After-tax Return on Total Stockholders Equity Asset Turnover 0.15 0.14 0.151 -7% After-tax Return on Total Stockholders Equity Asset Turnover 0.551 0.52 0.55 -6% BE 5634.15 BE 79614 5634.15 1313% Book/Market 0.27 Book Market 0.23 0.27 -16% Capitalization Ratio 0.24 0.23 0.2412 -5% 0.56 1.06 0.56 - 90% Cash Balance/Total Liabilities Capitalization Ratio Cash Balance/Total Liabilities Cash Conversion Cycle (Days) 66.63 3.48 66.63-95% Cash Conversion Cycle (Days) Cash Flow Margin 0.2 0.2 0.22-12 Cash Flow Margin Cash Flow/Total Debt 0.27 0.3 0.27 11% Cash Flow/Total Debt Cash Ratio 1.29 Cash Ratio 2.04 1.2958% 0.75 0.77 0.751 - 2% Common Equity/Invested Capital Current Liabilities/Total Liabilities Current Ratio 0.47 Common Equity/Invested Capital Current Liabilitica/Total Liabilities Current Ratio 0.52 0.47 10% 2.21 2.57 2.211 16% 0.25 0.82 0.25 - 232% Dividend Payout Ratio Dividend Payout Ratio Dividend Yield 0.03 Dividend Yield 0.03 0.03-02 Effective Tax Rate 0.24 0.34 0.24 42% 13.11 11.78 13.11 -10% 0.83 0.79 0.83 -4% Enterprise Value Multiple Free Cach Flow/Operating Cash Flow Gross Profit Margin 0.64 0.71 0.64 12% Effective Tax Rate Enterprise Value Multiple Free Cach Flow/Operating Cash Flow Gross Profit Margin Gross Profit/Total Assets Interest Coverage Ratio Interest/Average Long-term Debt 0.34 0.37 0.341 - 10% Gross Profit/Total Assets 16.22 31.05 16.22 / 912 Interest Coverage Ratio Interest/Average Long term Debt 0.04 0.03 0.04-11% 0.04 0.03 0.04-26% Interest/Average Total Debt Inventory Turnover 5.97 9.25 5.971 55% Interest/Average Total Debt Inventory Turnover Inventory/Curren tAsseto 0.03 0.02 0.03 - 11% Inventory/Current Assets Labor Expence Sales NA Labor NA NA Expenses/Sales 0.3 0.29 0.312-4% Long-term Debt/Book Equity 0.24 0.23 0.241 -5% Long-term Debt/Invested Capital Long-term Debt/Book Equity Long-term Debt/Invested Capital Long-term Debt/Total Liabilities Net Profit Margin 0.35 0.28 Long-term Debt/Total Liabilities 0.351 -20% Net Profit Margin 0.14 0.14 0.142-43 0.63 0.63 0.63 -0% Operating CF/Current Liabilities | 0.2 0.3 0.21 49% Operating Profit Margin Alter Depreciation Operating Profit Margin Before Depreciation PIE (Diluted, Excl. EI) Operating CF/Current Liabilities Operating Profit Margin After Depreciation Operating Profit Margin Before Depreciation PIE (Diluted, Excl. El) 0.28 0.36 0.281-30% 21.85 37.23 21.851 70% PIE (Diluted, Incl. EI) 23.54 37.23 23.54-58% PIE (Diluted, Incl. EI) Payable Turnover 6.54 3.97 6.541 -39% Pre-tax Profit Margin 0.18 0.2 0.181 29% Payables Turnover Pre-tax Profit Margin Pre-tax return on Net Operating Assets 0.35 0.311 0.35-10% Pre-tax return on Net Operating Assets 0.21 0.2 0.211-2% Pre-tax Return on Total Earning Assets Pre-tax Return on Total Earning | Assets Price/Book PriceBook 3.67 5.52 3.671-50% Price/Cash flow 13.6 PricelCash flow 15 13.6 - 10% 20.98 21.34 20.382% Price/Operating Earnings (Basic, Excl. ) Price/Operating Earnings (Diluted, Excl. EI) 21.49 Price/Operating Earning: (Basic, Excl. EI) Price/Operating Earnings (Diluted, Excl. EI) 21.5 21.490% Price/Sales 3.28 Price/Sales 4.84 3.28 - 48% 0.79 0.7 0.791 -11% Profit Before Depreciation Current Liabilities Profit Before Depreciation/Cur rent Liabilities 2.09 2.51 2.09 20% Quick Ratio (Acid Test) Receivables Turnover Quick Ratio (Acid Test) Receivables Turnover 6.76 6.26 6.761-7% 0.18 0.12 0.18 -33% Receivables/Current Assets Research and Development/Sales 0.13 0.13 0.13|-- 5% Receivables/Curr ent Assets Research and Development/Sal cs Return on Assets Return on Assets 0.16 0.19 0.16 20% 0.16 0.23 0.162 43% Return on Capital Employed Return on Capital Employed Return on Equity Return on Equity 0.15 0.14 0.15 Sales/Invested Capital 0.83 SaleslInvested Initi 0.82 0.83 -1% 1.1 1.07 1.11-3% 2.41 1.24 2.41-43% Sales/Stockholders Equity Sales/Working Capital Shillero Cyclically Adjusted P/E Ratio Salco/Stockhold ers Equity Sales/Working Capital Shillers Cyclically Adjusted P/E Ratio 22.8 22.06 22.8 -3% 0.11 0.24 0.11 - 116% Short-Tarm Debt/Total Debt Total Debt/Capital Short-Term DebtTotal Debt Total Debt/Capital 0.31 0.32 0.31 - 4% Total Debt/EBITDA 1.32 1.02 1.321-23% Total Debt/Equity 0.99 1.06 0.99 7% 0.29 0.3 0.29 -6% Total Debt/Invested Capital 0.19 0.13 0.19-13 Total Debt/Total Assets Total Liabilities/Total Tangible Assets Total Debt/EBITDA Total Debt/Equity Total Debt/Invested Capital Total Debt/Total Assets Total Liabilities/Total Tangible Asseto Total Liability/Total Assets Trailing P/E to Growth (PEG) ratio 6.76 6.25 6.761-83 0.5 0.52 Total Liability/Total Assets 0.52% 1.66 NA 1.66 Trailing P/E to Growth (PEG) ratio


