

Question: please complete 1 2 and 3(there is no additional information) thanks CHAPTER 9 1. What liabilities does the company list as current liabilities? 2. Does
please complete 1 2 and 3(there is no additional information) thanks
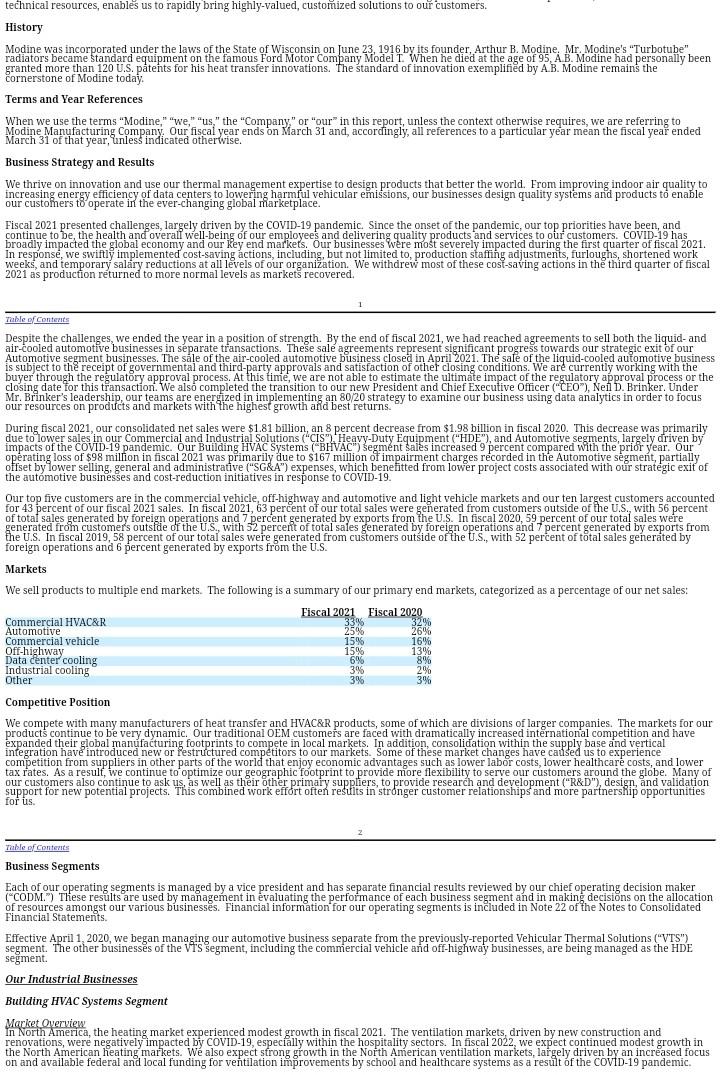
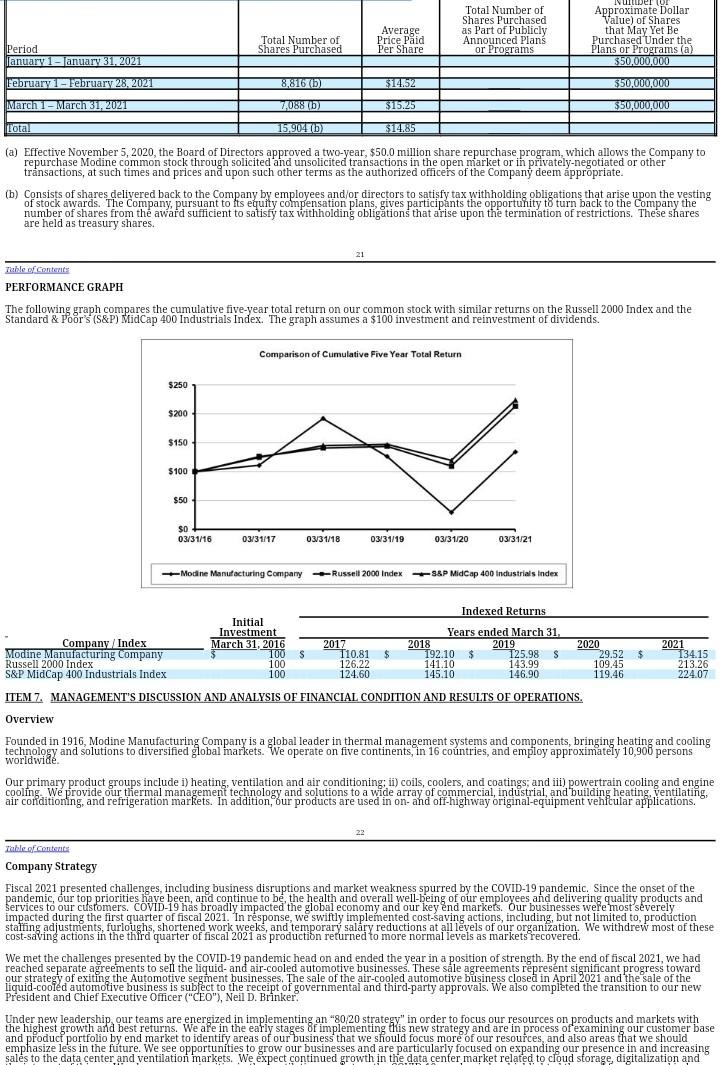
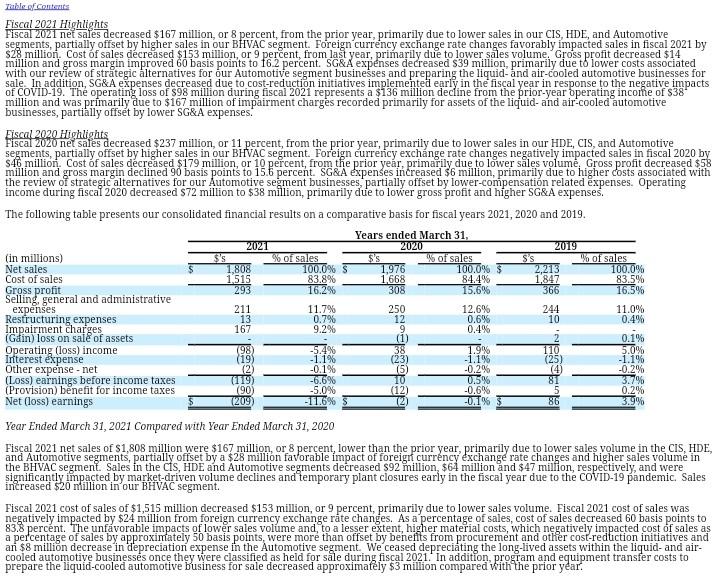
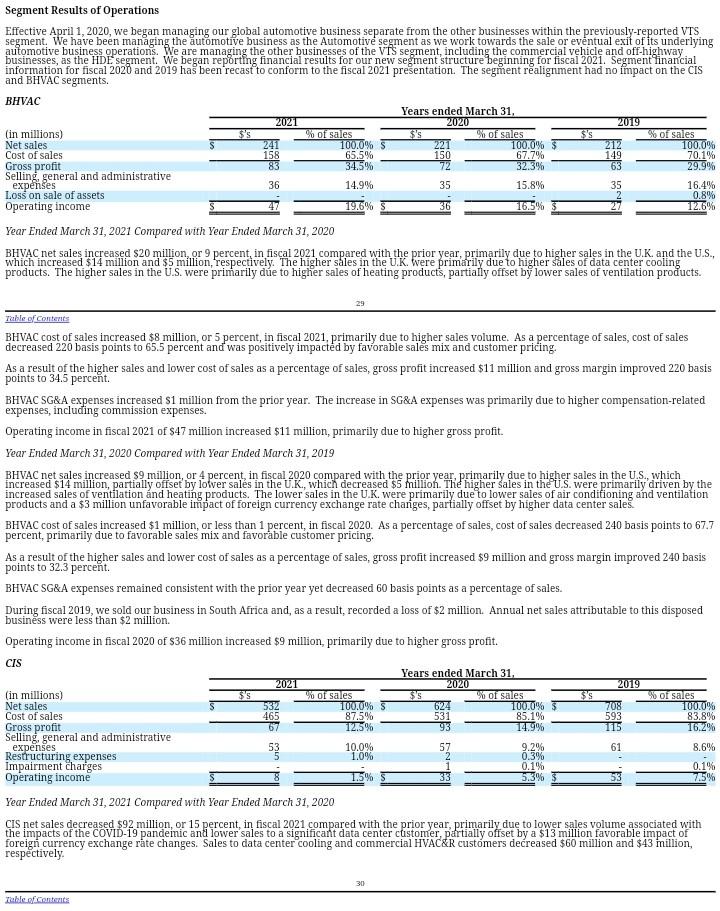
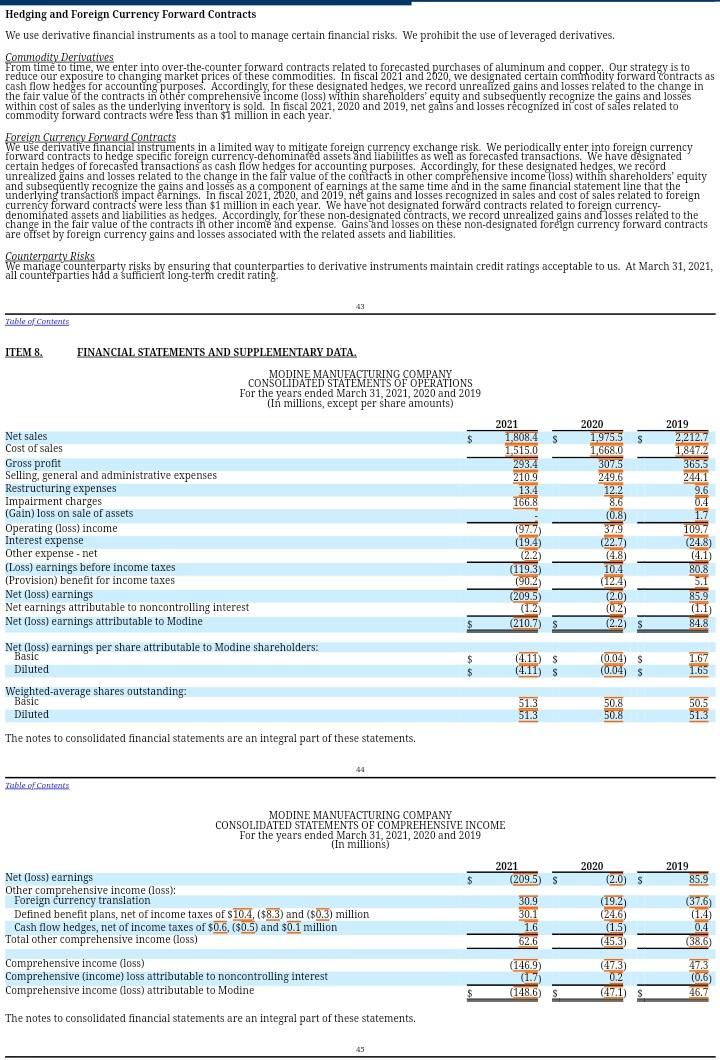
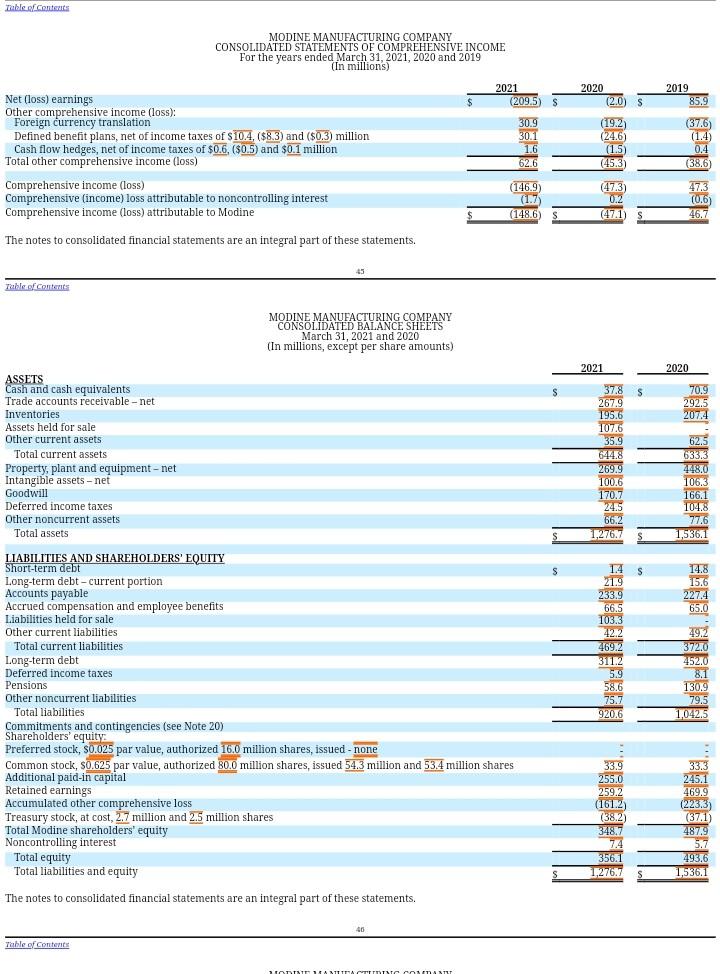
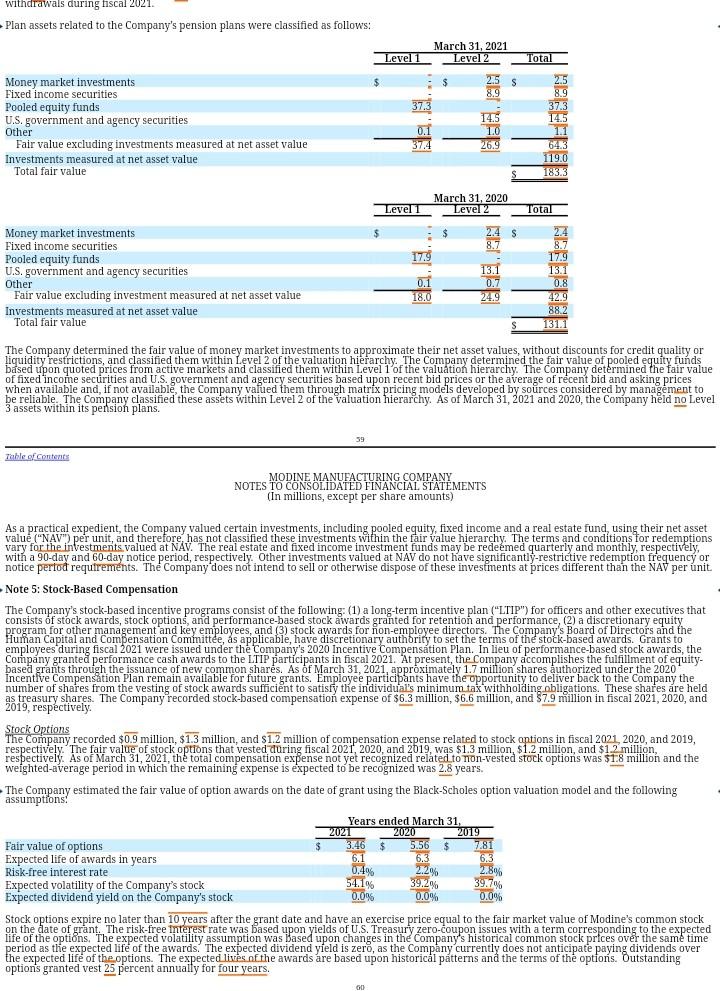
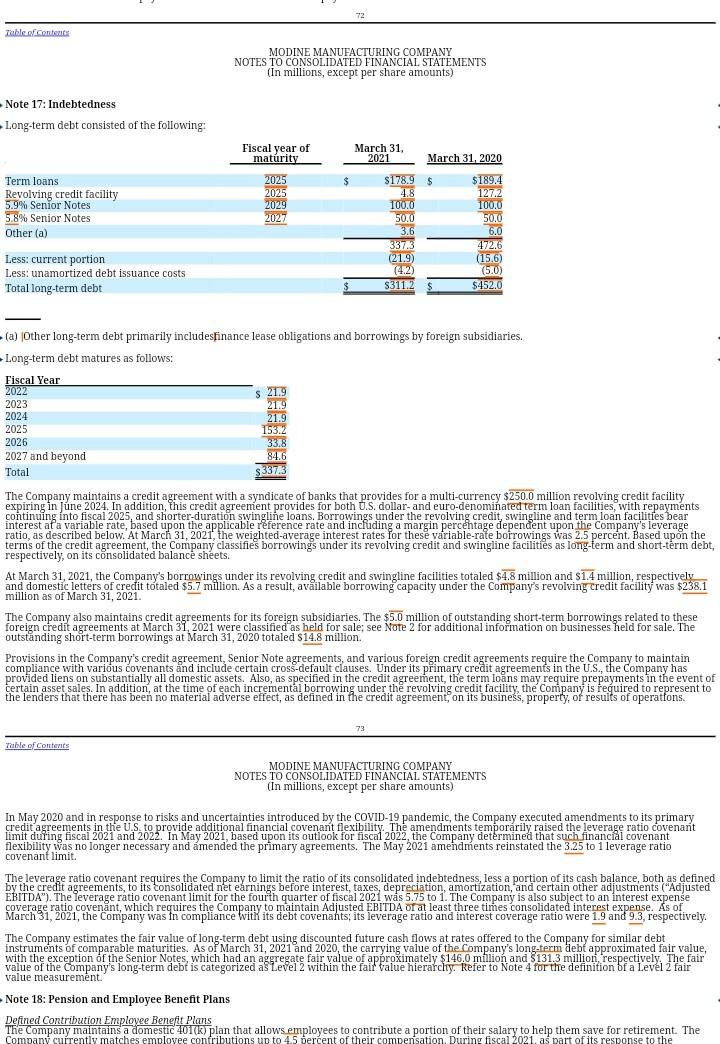
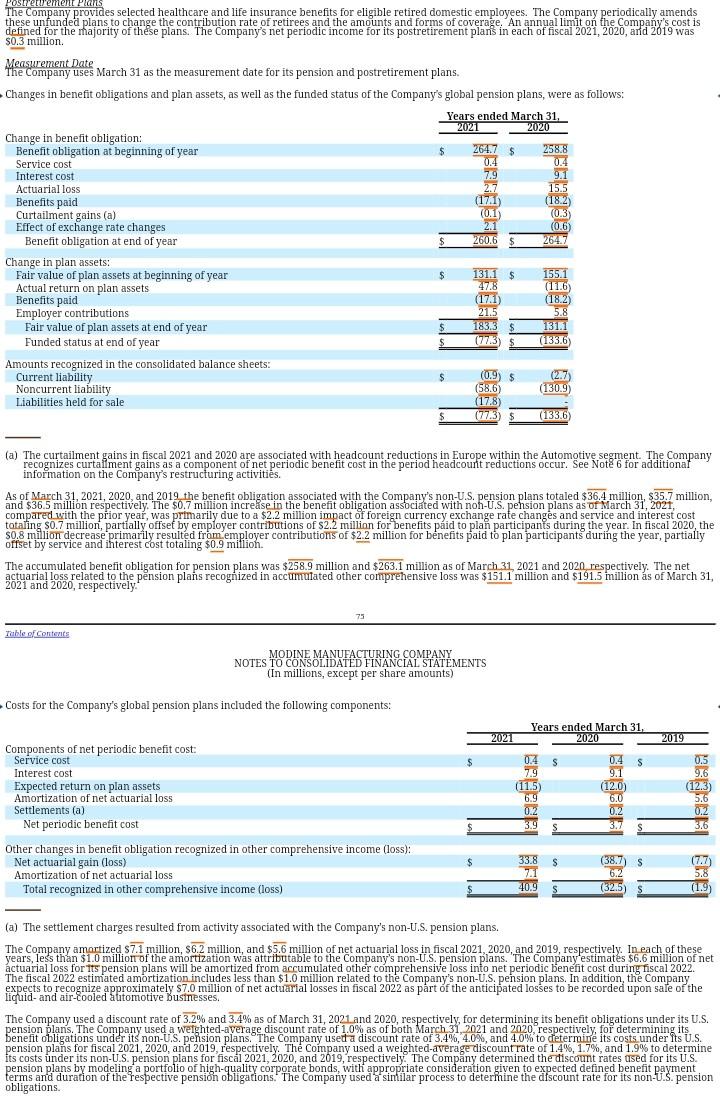
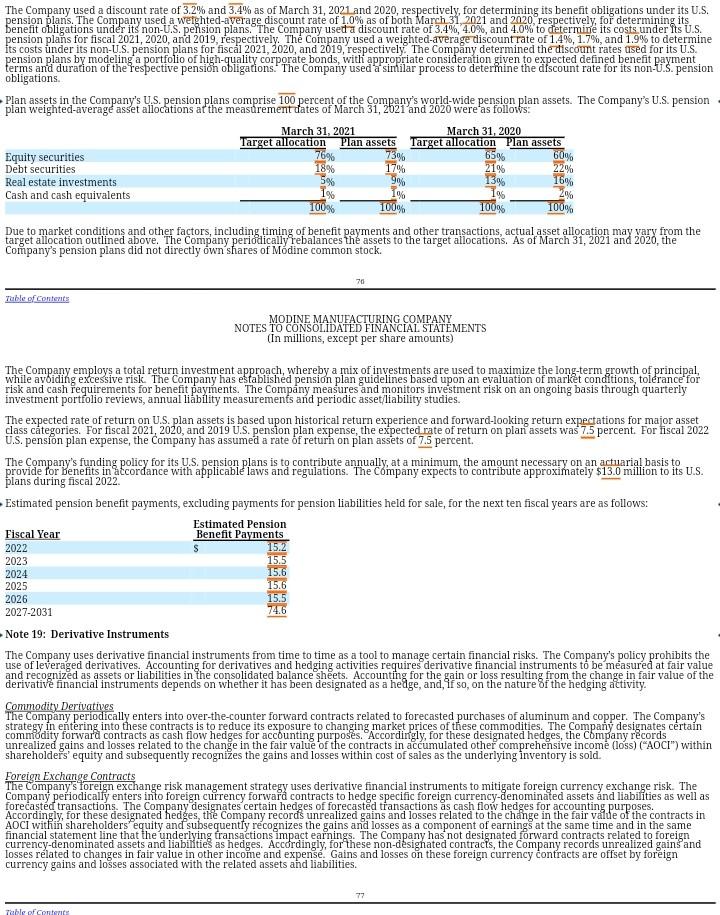
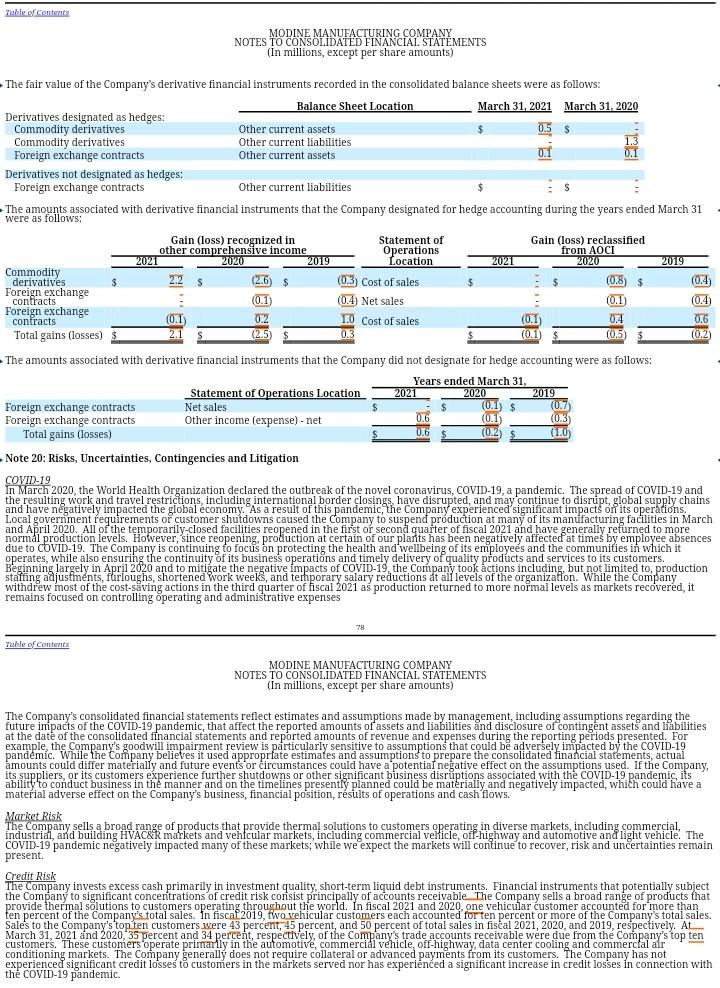
CHAPTER 9 1. What liabilities does the company list as current liabilities? 2. Does the company report any accounts payable in its current liabilities? 3. Has accounts payable increased or decreased during the year? We operate manufacturing facilities located in the U.S. and in multiple foreign countries. Our world headquarters, including general offices and laboratory, experimental and tooling facilities, is located in Racine, Wisconsin. We have additional technical support functions located in Grenada, China; and Chennai, India. Mississippi Leeds, United Kingdom, Pocenia, Italy, Guadalajara, Spain; Bonlanden, Germany, Sderkping, Sweden, Sao Paulo, Brazil Changzhou, The following table summarizes the number of manufacturing facilities within each of our operating segments as of March 31, 2021. Americas Europe Asia Total BHVAC HDE Automotive Total manufacturing facilities Of the facilities summarized in the table above, 22 include leased manufacturing space. We consider our plants and equipment to be well maintained and suitable for their purp facilities as necessary to meet changing , We review our manufacturing capacity conditley and make the determination as to our need to expand or, ITEM 3. LEGAL PROCEEDINGS The information required hereunder is incorporated by reference from Note 20 of the Notes to Consolidated Financial Statements. ITEM 4. MINE SAFETY DISCLOSURES. Not applicable. Name Tables ble of Contents INFORMATION ABOUT OUR EXECUTIVE OFFICERS. The following sets forth the name, age (as of March 31, 2021), recent business experience and certain other information relative to each executive officer of the Company. Age Position Brian Agen Vice President, Human Resources (October 2012 - Present). Neil D. Brinker 45 President and Chief Executive Officer (December 2020 - Present). Prior to joining Modine, Mr. Brinker served as President and Chief Operating Officer of Advanced E! Executive Vice President and Chief Industries Inc. after serving as its Energy , Operating Officer. Prior to join Mr. Brinker served as a Group President at IDEX Corporation. Joel T. Casterton 49 Vice President, Heavy Duty Equipment (April 2020 - Present); previously Vice President, Vehicular Thermal Solutions and Director - Global Program Management and Quality for the Company Michael B. Lucareli 52 Executive Vice President, Chief Financial Officer (May 2021 - Present): previously Vice President, Finance and Chief Financial Officer for the Company Matthew J. McBurney 51 Vice President, Corporate Strategy & HVAC (February 2021-ying and Development, and Vice Presiding HVAC and Commercial and Industrial Solutions Integration for the Company Scott A. Miller 56 Vice President, Commercial and Industrial Solutions (January 2021 - Present); previously Vice President, Global Coils and Coolers, Vice President, Building HVAC, and Managing Director - Global 54 Sylvia A. Stein for per president, the companilisel, Secretary and Chief Compliance Officer (February 2020 - Present); previously Vice President, General Counsel and Corporate Secretary for the Company. Prior to joining Modine, Ms. Stein served as the Associate General Counsel, Marketing & Regulatory at the Kraft Heinz Foods Company Executive Officer positions are designated in our Bylaws and the persons holding these positions are elected annually by the Board, generally at its first meeting after the annual meeting of shareholders in July of each year. In addition, the Human Capital and Compensation Committee of the Board may recommend and the Board of Directors may approve promotions and other actions with regard to executive officers at any time during the fiscal year. There are no family relationships among the executive officers and directors. All of the executive officers of Modine have been employed by us in various capacities during the last five years with the exception of Mr. Brinker and Ms. Stein, who joined in December 2020 and January 2018, respectively, whose business experience during the last five years is described above. There are no arrangements or understandings between any of the executive officers and any other person pursuant to which he or she was elected an officer of Modine. Table of content PART II ITEM 5. MARKET FOR REGISTRANT'S COMMON EQUITY. RELATED STOCKHOLDER MATTERS AND ISSUER PURCHASES OF EQUITY SECURITIES, Our common stock is listed on the New York Stock Exchange. Our trading symbol is MOD. As of March 31, 2021, shareholders of record numbered We did not pay dividends during fiscal 2021 or 2020. Under our credit agreements, we are permitted to pay dividends on our common stock, subject Management's Discussion and Analysis of Financial Condition and Results of Operations. We currently do not intend to pay dividends in fiscal 2022. The following describes the Company's purchases of common stock during the fourth quarter of fiscal 2021: Maximum Number (or Total Number of Approximate Dollar Shares Purchased Value) of Shares Average as part of Publicly that May Yet Be Total Number of Price Paid Announced Plans Purchased Under the Period Shares Purchased Per Share or Programs Plans or Programs (a) January 1-anuary 31, 2021 $50,000,000 February 1 - February 28, 2021 8,86%D) $14.52 350.000.000 March 1 - March 31, 2021 7,088 (b) $15.25 350,000,000 rota 15.904 (6) $14.85 (a) Effective November 5, 2020, the Board of Directors approved a two-year, $50.0 million share repurchase program, which allows the Company to repurchase Modine common stock through solicited and unsolicited transactions in the open market or in privately-negotiated or other transactions, at such times and prices and upon such other terms as the authorized officers of the Company deem appropriate. (b) of shares delivered back to the Company by employees and/or directors to satisfy tax withholding obligations that arise upon the vesting Consists Total Number of Shares Purchased as part of Publicly Announced Plans or Programs Average Price Paid Per Share Total Number of Shares Purchased Approximate Dollar Value) of Shares that May Yet Be Purchased Under the Plans or Programs (a) $50.000.000 Period Ianuary 1-January 31, 2021 February 1-February 28.02 881 CDI $1452 350,000,000 March 1 - March 31, 2021 7,088 (D) $15.25 $50,000 UUD Lotal 16290416) 314.85 (a) Effective November 5, 2020, the Board of Directors approved a two-year, $50.0 million share repurchase program, which allows the Company to repurchase Modine common stock through solicited and unsolicited transactions in the open market or in privately-negotiated or other transactions, at such times and prices and upon such other terms as the authorized officers of the Company deem appropriate. (b) Consists of shares delivered back to the Company by employees and/or directors to satisfy tax withholding obligations that arise upon the vesting of stock awards. The Company, pursuant to its equity compensation plans, gives participants the opportunity t8 turn back to the Company the number of shares from the award sufficient to satisfy tax withholding obligations that arise upon the termination of restrictions. These shares are held as treasury shares. 21 Tuhle of Conte PERFORMANCE GRAPH The following graph compares the cumulative five-year total return on our common stock with similar returns on the Russell 2000 Index and the Standard & Poor's (S&P) Mid Cap 400 Industrials Index. The graph assumes a $100 investment and reinvestment of dividends. Comparison of Cumulative Five Year Total Return $250 $200 $150 $100 $50 $0 03/31/16 03/31/17 03/31/18 03/31/19 03/31/20 03/31/21 Modine Manufacturing Company Russell 2000 Index SSP Mid Cap 400 Industrials Index $ Indexed Returns Initial - Investment Years ended March 31, Company Inde March 31, 2016 2017 2018 2019 2020 Modine Manning Company 100 S T10.81 $ 192.10 $ 125.98 S 29.52 Russell 2000 Index 100 126.22 141.10 143.99 109.45 S&P Mid Cap 400 Industrials Index 100 124.60 145.10 146.90 119.46 ITEM 7. MANAGEMENT'S DISCUSSION AND ANALYSIS OF FINANCIAL CONDITION AND RESULTS OF OPERATIONS. Overview 2021 134.15 213.26 224.07 Founded in 1916, Modine Manufacturing Company is a global leader in thermal management systems and components, bringing heating and cooling technology and solutions to diversified global markets. We operate on five continents, in 16 countries, and employ approximately 10,900 persons worldwide Our primary product groups include i) heating, ventilation and air conditioning; ii) coils, coolers, and coatings and iii) powertrain cooling and engine cooling. We provide our thermal management technology and solutions to a wide array of commercial, industrial, and building heating, ventilating, air conditioning, and refrigeration markets. In addition, our products are used in on and off-highway original-equipment vehicular applications. 22 Table of content Company Strategy Fiscal 2021 presented challenges, including business disruptions and market weakness spurred by the COVID-19 pandemic. Since the onset of the pandemic, our top priorities have been, and continue to be the health and overall well-being of our employees and delivering quality products and Services to our customers. COVID-19 has broadly impacted the global economy and our key end markets. Our businesses were most severely impacted during the first quarter of fiscal 2021. In response, we swiftly implemented cost-saving actions, including, but not limited to, production staffing adjustments, furloughs shortened work weeks, and temporary salary reductions at all levels of our organization. We withdrew most of these cost-saving actions in the third quarter of fiscal 2021 as production returned to more normal levels as markets recovered. We met the challenges presented by the COVID-19 pandemic head on and ended the year in a position of strength. By the end of fiscal 2021, we had reached separate agreements to sell the liquid- and air-cooled automotive businesses. These sale agreements represent significant progress toward our strategy of exiting the Automotive segment businesses. The sale of the air-cooled automotive business closed in April 2021 and the sale of the liquid-cooled automotive business is subject to the receipt of governmental and third-party approvals. We also completed the transition to our new President and Chief Executive Officer ("CEO"), Neil D. Brinker Under new leadership, our teams are energized in implementing an "80/20 strategy" in order to focus our resources on products and markets with the highest growth and best returns. We are in the early stages 8f implementing this new strategy and are in process of examining our customer base and product portfolio by end market to identify areas of our business that we should focus more of our resources, and also areas that we should emphasize less in the future. We see opportunities to grow our businesses and are particularly focused on expanding our presence in and increasing sales to the data center and ventilation markets. We expect continued growth in the data cenfer market related to cloud storage, digitalization and Table of Contents Fiscal 2021 Highlights Fiscal 2021 net sales decreased $167 million, or 8 percent, from the prior year, primarily due to lower sales in our CIS, HDE, and Automotive segments, partially offset by higher sales in our BHVAC segment. Foreign currency exchange rate changes favorably impacted sales in fiscal 2021 by $28 million. Cost of sales decreased $153 million, or 9 percent, from last year, primarily due to lower sales volume. Gross profit decreased $14 million and gross margin improved 60 basis points to 16.2 percent. SG&A expenses decreased $39 million, primarily due to lower costs associated with our review of strategic alternatives for our Automotive segment businesses and preparing the liquid-and air-cooled automotive businesses for sale. In addition, SG&A expenses decreased due to cost-reduction initiatives implemented early in the fiscal year in response to the negative impacts of COVID-19. The operating loss of S98 million during fiscal 2021 represents a $136 million decline from the prior-year operating income of $38 million and was primarily due to $167 million of impairment charges recorded primarily for assets of the liquid- and air-cooled automotive businesses, partially offset by lower SG&A expenses Eiscal 2020 Highlights Fiscal 2020 net sales decreased $237 million, or 11 percent, from the prior year, primarily due to lower sales in our HDE, CIS, and Automotive segments, partially offset by higher sales in our BHVAC segment. Foreign currency exchange rate changes negatively impacted sales in fiscal 2020 by S46 million Cost of sales decreased $179 million, or 10 percent, from the prior year, primarily due to lower sales volum. Gross profit decreased $58 million and gross margin declined 90 basis points to 15.6 percent. SG&A expenses increased $6 million, primarily due to higher costs associated with the review of strategic alternatives for our Automotive segment businesses, partially offset by lower-compensation related expenses. Operating income during fiscal 2020 decreased $72 million to $38 million, primarily due to lower gross profit and higher SG&A expenses The following table presents our consolidated financial results on a comparative basis for fiscal years 2021, 2020 and 2019. Years ended March 31, 2021 2020 2019 (in millions) % of sales $'s of sales S'S W of sales Net sales 1,808 100.0% 5 1,976 100.0% 2,215 100.0% Cost of sales 1.515 83.8% 1.668 84.4% 1.847 83.5% Gross profit 293 16.2% 308 15.6% 366 16.5% Selling, general and administrative expenses 211 11.7% 250 12.6% 244 11.0% Restructuring expenses 13 0.7% 12 0.6% 10 0.4% Impairment charges 167 9.2% 9 0.4% (din) loss on sale of assets (1) 0.1% Operating (loss) income 198) -5.4% 1.99% 110 5.0% Interest expense (19) -1.1% -1.1% (25) -1.1% Other expense - net (2) -0.1% -0.2% (4) -0.2% (Loss) earnings before income taxes (119) -6.6% 0.5% 81 3.7% (Provision) benefit for income taxes (90) -5.0% -0.6% 0.2% Net (loss) earnings (209) -111.6 -0.1% 86 3.9% Year Ended March 31, 2021 Compared with Year Ended March 31, 2020 Fiscal 2021 net sales of $1,808 million were $167 million, or 8 percent, lower than the prior year, primarily due to lower sales volume in the CIS, HDE, and Automotive segments, partially offset by a $28 million favorable impact of foreign currency exchange rate changes and higher sales volume in the BHVAC segment Sales in the cls, HDE and Automotive segments decreased $92 million $64 million and $47 million, respectively, and were significantly impacted by market-driven volume declines and temporary plant closures early in the fiscal year due to the COVID-19 pandemic. Sales increased $20 million in our BHVAC segment. Fiscal 2021 cost of sales of $1,515 million decreased $153 million, or 9 percent, primarily due to lower sales volume. Fiscal 2021 cost of sales was negatively impacted by $24 million from foreign currency exchange rate changes. As a percentage of sales, cost of sales decreased 60 basis points to 83.8 percent. The unfavorable impacts of lower sales volume and, to a lesser extent, higher material costs, which negatively impacted cost of sales as a percentage of sales by approximately 50 basis points, were more than offset by benefits from procurement and other cost-reduction initiatives and an $8 million decrease in depreciation expense in the Automotive segment. We ceased depreciating the long-lived assets within the liquid and air- cooled automotive businesses once they were classified as held for sale during fiscal 2021. In addition, program and equipment transfer costs to prepare the liquid-cooled automotive Business for sale decreased approximately $3 million compared with the prior year. Segment Results of Operations Effective April 1, 2020, we began managing our global automotive business separate from the other businesses within the previously-reported VTS segment. We have been managing the automotive business as the Automotive segment as we work towards the sale or eventual exit of its underlying automotive business operations. We are managing the other businesses of the VTS segment, including the commercial vehicle and off-highway businesses, as the HDE segment. We began reporting financial results for our new segment structure beginning for fiscal 2021. Segment financial information for fiscal 2020 and 2019 has been recast to conform to the fiscal 2021 presentation. The segment ralignment had no impact on the CIS and BHVAC segments. BHVAC Years ended March 31, 2021 2020 2019 (in millions) $'s % of sales % of sales $'s or sales Net sales 241 100.0% 221 100.0% 27112 100.0% Cost of sales 158 65.5% 150 67.7% 149 70.1% Gross profit 83 34.5% 72 32.3% 63 29.9% Selling, general and administrative expenses 36 14.9% 35 15.8% 35 16.4% Loss on sale of assets 0.8% Operating income 19.6% S 16.5% 12.6% Year Ended March 31, 2021 Compared with Year Ended March 31, 2020 BHVAC net sales increased $20 million, or 9 percent, in fiscal 2021 compared with the prior year, primarily due to higher sales in the U.K. and the U.S., which increased $14 million and $5 million, respectively. The higher sales in the U.K. were primarily due to higher sales of data center cooling products. The higher sales in the U.S. were primarily due to higher sales of heating products, partially offset by lower sales of ventilation products. Nail Table of Contents BHVAC cost of sales increased $8 million, or 5 percent, in fiscal 2021, primarily due to higher sales volume. As a percentage of sales, cost of sales decreased 220 basis points to 65.5 percent and was positively impacted by favorable sals mix and customer pricing. As a result of the higher sales and lower cost of sales as a percentage of sales, gross profit increased $11 million and gross margin improved 220 basis points to 34.5 percent. BHVAC SG&A expenses increased $1 million from the prior year. The increase in SG&A expenses was primarily due to higher compensation-related expenses, including commission expenses. Operating income in fiscal 2021 of $47 million increased $11 million, primarily due to higher gross profit. Year Ended March 31, 2020 compared with Year Ended March 31, 2019 BHVAC net sales increased $9 million, or 4 percent, in fiscal 2020 compared with the prior year, primarily due to higher sales in the US., which increased $14 million, partially offset by lover sales in the U.K., which decreased $5 million. The higher sales in the U.S. were primarily driven by the increased sales of ventilation and heating products. The lower sales in the U.K. were primarily due to lower sales of air conditioning and ventilation products and a $3 million unfavorable impact of foreign currency exchange rate changes, partially offset by higher data center sales BHVAC cost of sales increased $1 million, or less than 1 percent, in fiscal 2020. As a percentage of sales, cost of sales decreased 240 basis points to 67.7 percent, primarily due to favorable sales mix and favorable customer pricing. As a result of the higher sales and lower cost of sales as a percentage of sales, gross profit increased $9 million and gross margin improved 240 basis points to 32.3 percent. BHVAC SG&A expenses remained consistent with the prior year yet decreased 60 basis points as a percentage of sales. During fiscal 2019, we sold our business in South Africa and, as a result, recorded a loss of $2 million. Annual net sales attributable to this disposed business were less than $2 million. Operating income in fiscal 2020 of $36 million increased $9 million, primarily due to higher gross profit. CIS Years ended March 31, (in millions) $s w of sales of sales 3's of sales Net sales 552 100.0% 5 624 100.0% 708 100.0% Cost of sales 465 87.5% 531 85.1% 593 83.8% Gross profit 67 12.5% 93 14.9% 115 16.2% Selling, general and administrative expenses 53 57 9.2% 61 8.6% Restructuring expenses 1.0% 0.3% Impairment charges 0.1% 0.1% Operating income 513% 7,5% Year Ended March 31, 2021 Compared with Year Ended March 31, 2020 IS net sales decreased $92 million, or 15 percent, in fiscal 2021 compared with the prior year, primarily due to lower sales volume associated with the impacts of the COVID-19 pandeinic and lower sales to a significant data center customer, partially offset by a $13 million favorable impact of foreign currency exchange rate changes. Sales to data center cooling and commercial HVAC&R customers decreased $60 million and $43 million, respectively 2021 2020 2019 $'s 10.0% 30 Table of Contents Hedging and Foreign Currency Forward Contracts We use derivative financial instruments as a tool to manage certain financial risks. We prohibit the use of leveraged derivatives. Commodity Derivatives From time to time, we enter into over-the-counter forward contracts related to forecasted purchases of aluminum and copper. Our strategy is to reduce our exposure to changing market prices of these commodities. In fiscal 2021 and 2020, we designated certain commodity forward Contracts as cash flow hedges for accounting purposes. Accordingly, for these designated hedges, we record unrealized gains and losses related to the change in the fair value of the contracts in other comprehensive income (loss) within shareholders' equity and subsequently recognize the gains and losses within cost of sales as the underlying inventory is sold. In fiscal 2021, 2020 and 2019, net gains and losses recognized in cost of sales related to commodity forward contracts were less than $1 million in each year. Foreign Currency Forward Contracts We ue derivative financial instruments in a limited way to mitigate foreign currency exchange risk. We periodically enter into foreign currency forward contracts to hedge specific foreign currency-denominated assets and liabilities as well as forecasted transactions. We have designated certain hedges of forecasted transactions as cash flow hedges for accounting purposes. Accordingly, for these designated hedges, we record unrealized gains and losses related to the change in the fair value of the contracts in other comprehensive income (loss) within shareholders' equity and subsequently recognize the gains and losses as a component of earnings at the same time and in the same financial statement line that the underlying transactions impact earnings. In fiscal 2021, 2020, and 2019, net gains and losses recognized in sales and cost of sales related to foreign currency forward contracts were less than $1 million in each year. We have not designated forward contracts related to foreign currency- denominated assets and liabilities as hedges. Accordingly, for these non-designated contracts, we record unrealized gains and losses related to the change in the fair value of the contracts in other income and expense. Gains and losses on these non-designated foreign currency forward contracts are offset by foreign currency gains and losses associated with the related assets and liabilities. Counterparty Risks we manage counterparty risks by ensuring that counterparties to derivative instruments maintain credit ratings acceptable to us. At March 31, 2021, all counterparties had a sufficient long-term credit rating Table of Contents ITEM 8. FINANCIAL STATEMENTS AND SUPPLEMENTARY DATA. MODINE MANUFACTURING COMPANY CONSOLIDATED STATEMENTS OF OPERATIONS For the years ended March 31, 2021, 2020 and 2019 (In millions, except per share amounts) $ s 2021 1,808. 1.515.0 293.4 210.9 13.4 166.8 Net sales Cost of sales Gross profit Selling, general and administrative expenses Restructuring expenses Impairment charges (Gain) loss on sale of assets Operating (loss) income Interest expense Other expense - net (Loss) earnings before income taxes (Provision) benefit for income taxes Net (loss) earnings Net earnings attributable to noncontrolling interest Net (loss) earnings attributable to Modine Net (loss) earnings per share attributable to Modine shareholders: Basic Diluted Weighted average shares outstanding: Diluted (9747 (19.4) (2.2) (119.3) (90.2 (209.5 ( (1.2 (210.7) S 2020 1,975.5 s 1,668.0 307.5 249.6 12.2 8.6 (0.8) 37.9 (22.7) (4.8) 10.4 (12.4) (2.0) (0.2) (2.2) S ( 2019 2,212.7 1,847.2 365.5 244.1 9.6 0.4 1.7 109.7 (24.8) (4.1) 80.8 5.1 85.9 (1.1 84.8 $ $ ( (4.11) S (4.11) S S (0.04) S (0.04) S 1.67 1.65 Basic 51.3 51.3 50.8 50.8 50.5 51.3 The notes to consolidated financial statements are an integral part of these statements. Table of Content MODINE MANUFACTURING COMPANY CONSOLIDATED STATEMENTS OF COMPREHENSIVE INCOME For the years ended March 31, 2021, 2020 and 2019 (In millions) 2021 (209.5) 5 () 2020 (2.0) 2019 85.9 S Net (loss) earnings Other comprehensive income (loss): Foreign currency translation Defined benefit plans, net of income taxes of $10.4, ($8.3) and ($0,3) million Cash flow hedges, net of income taxes of $0.6, (30.5) and 50.1 million Total other comprehensive income (loss) Comprehensive income (loss) Comprehensive (income) loss attributable to noncontrolling interest Comprehensive income (loss) attributable to Modine 30.9 30.1 1.6 62.6 (19.23 (24.6) (1.5) (45.3) (37.6) (1.4) 0.4 (38.6) (146.9 (1.7 (148.6 (473) 0.2 471) S 473 (0.6 46/7 The notes to consolidated financial statements are an integral part of these statements. Table of Contours MODINE MANUFACTURING COMPANY CONSOLIDATED STATEMENTS OF COMPREHENSIVE INCOME For the years ended March 31, 2021, 2020 and 2019 (In millions) 2021 (209.5) 2020 (2.0) 2019 85.9 $ S S Net (loss) earnings Other comprehensive income (loss): Foreign currency translation Defined benefit plans, net of income taxes of $10.4, ($8.3) and ($0.3) million Cash flow hedges, net of income taxes of $0.6, ($0.5) and $0.1 million Total other comprehensive income (loss) Comprehensive income (Loss) Comprehensive (income) loss attributable to noncontrolling interest Comprehensive income (loss) attributable to Modine 30.9 30.1 1.6 62.6 (19.2 (24.6) (1.5) (45.3) (37.6 (1.4) 0.4 (38.6) (146.9) (1.7 (148.6) (47.3) 0.2 (47.1) S 47.3 (0.6) 46.7 $ The notes to consolidated financial statements are an integral part of these statements. Table of Contents MODINE MANUFACTURING COMPANY CONSOLIDATED BALANCE SHEETS March 31, 2021 and 2020 (In millions, except per share amounts) 2021 2020 S 37.8 s 70.9 292.5 207.4 ASSETS Cash and cash equivalents Trade accounts receivable - net Inventories Assets held for sale Other current assets Total current assets Property, plant and equipment-net Intangible assets - net Goodwill Deferred income taxes Other noncurrent assets Total assets 267.9 195.6 107.6 35.9 644.8 269.9 100.6 170.7 24.5 66.2 1,276.7 62.5 633.3 448.0 106.3 166. 104.8 77.6 1,536.1 S 1.4 S 14.8 15.6 227.4 65.0 29.2 LIABILITIES AND SHAREHOLDERS' EQUITY Short-term debt Long-term debt-current portion Accounts payable Accrued compensation and employee benefits Liabilities held for sale Other current liabilities Total current liabilities Long-term debt Deferred income taxes Pensions Other noncurrent liabilities Total liabilities Commitments and contingencies (see Note 20) Shareholders' equity Preferred stock, S0.025 par value, authorized 16.0 million shares, issued - none Common stock, 90.625 par value, authorized 800 million shares, issued 54.3 million and 53.4 million shares Additional paid-in capital Retained earnings Accumulated other comprehensive loss Treasury stock, at cost, 2.7 million and 2.5 million shares Total Modine shareholders' equity Noncontrolling interest Total equity Total liabilities and equity 21.9 233.9 66.5 103.3 42.2 469.2 311.2 5.9 58.6 75.7 920.6 372.0 4520 8.1 13079 79.5 1,042,5 ( 33.9 255.0 259.2 (161.2 (38.2) 348,7 7.4 356.1 1,2767 33.3 245,1 469.9 (2233) (37.1) 487.9 5.7 493,6 1,536.1 The notes to consolidated financial statements are an integral part of these statements. 40 Table of content LODIE STAVITTATTITUATU 40 Table of Contents MODINE MANUFACTURING COMPANY CONSOLIDATED STATEMENTS OF CASH FLOWS For the years ended March 31, 2021, 2020 and 2019 (In millions) 2021 2020 2019 $ (209.5 s (2.0) S 68.6 166.8 77.1 8.6 (0.8) 6.6 1.0 5.6 6.3 67.9 6.3 36.6 (17.1) (5.0 44.0 15.7 27.5 (21.7) 149.8 (12.0) (377) (15.2) 14.7 (24.6) 57.9 Cash flows from operating activities: Net (loss) earnings Adjustments to reconcile net (Loss) earnings to net cash provided by operating activities: Depreciation and amortization Impairment charges (Gain) loss on sale of assets Stock-based compensation expense Deferred income taxes Other - net Changes in operating assets and liabilities: Trade accounts receivable Inventories Accounts payable Accrued compensation and employee benefits Other assets Other liabilities Net cash provided by operating activities Cash flows from investing activities: Expenditures for property, plant and equipment Proceeds from dispositions of assets Proceeds from sale of investment in affiliate Proceeds from maturities of short-term investments Purchases of short-term investments Other - net Net cash used for investing activities Cash flows from financing activities: Borrowings of debt Repayments of debt Borrowings on bank overdraft facilities - net Dividend paid to noncontrolling interest Purchase of treasury stock under share repurchase program Financing fees paid Other - net Net cash (used for) provided by financing activities Effect of exchange rate changes on cash Net (decrease) increase in cash, cash equivalents, restricted cash and cash held for sale Cash, cash equivalents, restricted cash and cash held for sale - beginning of year Cash, cash equivalents, restricted cash and cash held for sale - end of year The notes to consolidated financial statements are an integral part of these statements. BTSTHEO: bega, ea LLEEEEE and (32.7 0.7 (713) 6.2 3.8 4.1 (3.3) (3.6 0.9 (31.3 (60.5) 32.7 (183.6 3.6 672.0 (630.31 1.2 (1.3) (2.4) (2.8 (3.1) 33.3 (0.8 3.0 (145.1 (2.8 (25.9 1.4 (25.2 71.3 46. (1.6) 29.1 42.2 71.3 (2.7 1.9 40,3 42.2 Table of Contents MODINE MANUFACTURING COMPANY CONSOLIDATED STATEMENTS OF SHAREHOLDERS' EQUITY Table of Content MODINE MANUFACTURING COMPANY CONSOLIDATED STATEMENTS OF SHAREHOLDERS' EQUITY For the years ended March 31, 2021, 2020 and 2019 (In millions) , DHETER 0.8 Additional Treasury Common stock paid-in Retained Accumulated other stock, Non-controlling Shares Amount capital earnings comprehensive loss at cost interest Total Balance, March 31, 2018 52.3 $ 32.7 $ 229.9 $ 394.9 $ (140.3) $ (27.1) $ 8.4 $ 498.5 Adoption of new accounting guidance (Note 1) (7.6) (7.6) Net earnings 84.8 11 85.9 Other comprehensive loss (38.1 (0.5 (38.6 Stock options and awards 0.5 0.3 1.1 Purchase of treasury stock (4.3) (4.3 Stock-based compensation expense 7.9 7.9 Dividend paid to nonconfrolling interest (1.8 (1.8) Balance, March 31, 2019 52.8 33.0 238,6 472.1 (178.4) (31.4) 72 541.1 Net (loss) earnings (2.2) (2.0) Other comprehensive loss 44.9) (0.4) 45.3) Stock options and awards 0.6 0.3 (0.1 0.2 Purchase of treasury stock (5.7) (5.7 Stock-based compensation expense 6.6 6.6 Dividend paid to noncontrolling interest (1.3 (1.3 53.4 Balance, March 31, 2020 35 2455 469.9 (223.3) (37.1) 5.7 493.6 Net (loss) earnings (210.7 (209.5) Other comprehensive income 62.1 0.5 62.6 Stock options and awards 0.9 0.6 3.6 4.2 Purchase of treasury stock Stock-based compensation expense 6.3 6.3 Balance, March 31, 2021 33.9 $ (161.2) $ 7.4 $ 356.1 The notes to consolidated financial statements are an integral part of these statements. !!!!!!!!!! R... RI lo *** ! 54.3 $ 255.0 $ 259.2 $ (382) $ Table of Contents MODINE MANUFACTURING COMPANY NOTES TO CONSOLIDATED FINANCIAL STATEMENTS (In millions, except per share amounts) Note 1: Significant Accounting Policies Nature of Operations Modine Manufacturing Company ("Modine" or the "Company specializes in providing innovative thermal management solutions to diversified global markets and customers. The Company is a global leader in thermal management technology and solutions for sale into a wide array of commercial, industrial, and building heating, ventilating, air conditioning, and refrigeration ("HVAC&R") markets. In addition, the Company is a leading provider of engineered heat transfer systems arid high-quality heat transfer components for use in on and off-highway original equipment manufacturer ("OEM"/vehicular applications. The Company's primary product groups include i) heating, ventilation and air conditioning, ii) coils, coolers, and coatings, and iii) powertrain cooling and engine cooling. COVID-19 In March 2020, the World Health Organization declared the outbreak of the novel coronavirus, COVID-19, a pandemic. See Note 20 for additional information regarding the risks and uncertainties to our business resulting from this global pandemic. Disposition of Air-cooled Automotive Business On February 19, 2021, the Company signed a definitive agreement to sell its air-cooled automotive business to Schmid Metall GmbH. In connection with this sale, which closed on April 30, 2021, the Company classified the air-cooled automotive business as held for sale as of March 31, 2021. Accordingly, the company has reported the assets and liabilities of this business as held for sale on the March 31, 2021 consolidated balance sheet. See Note 2 for additional information. MODINE MANUFACTURING COMPANY CONSOLIDATED STATEMENTS OF COMPREHENSIVE INCOME For the years ended March 31, 2021, 2020 and 2019 (In millions) 2021 (209.5) 2020 (2.0) 2019 85.9 $ S 5 ( Net (loss) earnings Other comprehensive income (loss): Foreign currency translation Defined benefit plans, net of income taxes of $10.4, ($83) and ($0.3) million Cash flow hedges, net of income taxes of $0.6, (50.5) and $0.1 million Total other comprehensive income (loss) Comprehensive income (loss) Comprehensive (income) loss attributable to noncontrolling interest Comprehensive income (loss) attributable to Modine 30.9 30.1 1.6 62.6 (19.2 (24.6) (1.5) ( (45.3 (37.6 (1.4) 0.4 (38,6) (146.9) ( (117 (148.6) (473) 0.2 (47.1) S 47.3 (0.6) 46.7 The notes to consolidated financial statements are an integral part of these statements. 45 Tablew.contents MODINE MANUFACTURING COMPANY CONSOLIDATED BALANCE SHEETS March 31, 2021 and 2020 (In millions, except per share amounts) 2021 2020 S 37.8 70.9 292.5 207.4 ASSETS cash and cash equivalents Irade accounts receivable - net Inventories Assets held for sale Other current assets Total current assets Property, plant and equipment - net Intangible assets - net Goodwill Deferred income taxes Other noncurrent assets Total assets 267.9 195.6 107.6 35.9 644.8 269.9 100,6 170.7 24.5 66.2 1,276.7 62.5 633.3 448.0 106.3 166.1 104.8 77.6 1,536.1 s S S 14.8 15,6 227.4 65.0 LIABILITIES AND SHAREHOLDERS' EQUITY Short-term debt Long-term debt-current portion Accounts payable Accrued compensation and employee benefits Liabilities held for sale Other current liabilities Total current liabilities Long-term debt Deferred income taxes Pensions Other noncurrent liabilities Total liabilities Commitments and contingencies (see Note 20) Shareholders' equity. Preferred stock, 50.025 par value, authorized 16.0 million shares, issued - none Common stock, 50.625 par value, authorized 80.0 million shares, issued 54.3 million and 53.4 million shares Additional paid-in capital Retained earnings Accumulated other comprehensive loss Treasury stock, at cost, 2.7 million and 2.5 million shares Total Modine shareholders' equity Noncontrolling interest Total equity Total liabilities and equity 1.4 21.9 233.9 66.5 103.3 42.2 469.2 311.2 5.9 58.6 75.7 920.6 49.2 372.0 452.0 8.1 130.9 79,5 1.042.5 33.9 255.0 259.2 (161.23 (38.2 348.7 7.4 356.1 1,276 33.3 245.1 469.9 (223.3) (37.1) 487.9 5.7 493,6 1,536.1 l'he notes to consolidated financial statements are an integral part of these statements. Table of Contents MODINE MANUFACTURING COMPANY CONSOLIDATED STATEMENTS OF CASH FLOWS For the years ended March 31, 2021, 2020 and 2019 (In millions) COLOMON MODINE MANUFACTURING COMPANY CONSOLIDATED STATEMENTS OF CASH FLOWS For the years ended March 31, 2021, 2020 and 2019 (In millions) 2021 2020 2019 (209.5 s (2.0) $ 68.6 166.8 6.3 67.9 6.3 (12.0) (17.1 (5.0 44.0 15.7 27.5 (21.7 149.8 GELEN BEGEER JE (15.2) (32.7 (71.3) Cash flows from operating activities: Net (loss) earnings Adjustments to reconcile net (Loss) earnings to net cash provided by operating activities: Depreciation and amortization Impairment charges (Gain) loss on sale of assets Stock-based compensation expense Deferred income taxes Other - net Changes in operating assets and liabilities: Trade accounts receivable Inventories Accounts payable Accrued compensation and employee benefits Other assets Other liabilities Net cash provided by operating activities Cash flows from investing activities: Expenditures for property, plant and equipment Proceeds from dispositions of assets Proceeds from sale of investment in affiliate Proceeds from maturities of short-term investments Purchases of short-term investments Other - net Net cash used for investing activities Cash flows from financing activities: Borrowings of debt Repayments of debt Borrowings on bank overdraft facilities - net Dividend paid to noncontrolling interest Purchase of treasury stock under share repurchase program Financing fees paid Other - net Net cash (used for) provided by financing activities Effect of exchange rate changes on cash Net (decrease) increase in cash, cash equivalents, restricted cash and cash held for sale Cash, cash equivalents, restricted cash and cash held for sale - beginning of year Cash, cash equivalents, restricted cash and cash held for sale - end of year The notes to consolidated financial statements are an integral part of these statements. 0,7 3.4 (3.6 0.9 (31.3) Pada La Becle beaa. cel Lebate and (60.5) 32.7 (183.68 3.6 672.0 (630.3) 1.2 (1.3) (2.4) (2.8 (3.1) 33.3 (0.8 3.0 (145.1 Hua Heala- 1.4 (25.2 71.3 46.1 (1.6) 29. 42.2 COORAL The Company does not amortize goodwill; rather, it tests for impairment annually unless conditions exist that would require a more frequent evaluation. The Company performs an assessment of the fair value of its reporting units for goodwill impairment testing based upon, among other things, the present value of expected future cash flows. The Company performed its goodwilf impairmert test as of March 31, 2021 and determined the fair value of each of its reporting units exceeded the respective book value. See Note 14 for additional information Impairment of Held and Used Long-lived Assets, The Company reviews held and used long-lived assets, including property, plant and equipment and intangible assets, for impairment whenever events or changes in circumstances indicate that the carrying amount of the asset may not be fully recoverable. In these instances, the Company compares the undiscounted future cash flows expected to be generated from the asset with its carrying value. If the asset's carrying value exceeds expected future cash flows, the Company measures and records an impairment loss, if any, as the amount by which the carrying value of the asset exceeds its fair value. The Company estimates fair value using a variety of valuation techniques, including discounted cash flows, market values and comparison values for similar assets. Assets Held for Sale The Company considers assets to be held for sale when management approves and commits to a formal plan to actively market the asset for sale at a reasonable price in relation to its fair value, the asset is available for immediate sale in its present condition, an active program to locate a buyer and other actions required to complete the sale have been initiated, the sale of the asset is expected to be completed within one year and it is unlikely that significant changes will be made to the plan. Upon designation as held for sale, the Company records the carrying value of the assets at the lower of its carrying value or its estimated fair value, less costs to sell. The Company ceases to record depreciation expense at the time of designation as held for sale. During fiscal 2021, the Company classified the liquidad Note 2 for additional interesses as held for sale and recorded impairment I air-cooled automotive charges totaling 5166.8 million within the Automotives seginent. Deferred Compensation Trusts The Company maintains deferred compensation trusts to fund future obligations under its non-qualified deferred compensation plans. The trusts' investments in third-party debt and equity securities are presented within other noncurrent assets in the consolidated balance sheets. Self-insurance Reserves The Company retains a portion of the financial risk for certain insurance coverage, including property, general liability, workers compensation, and employee healthcare, and therefore maintains reserves that estimate the impact of unreported and under-reported claims that fall below various stop-loss limits and deductibles under its insurance policies. The Company maintains reserves for the estimated settlement cost of known claims, as well as estimates of incurred but not reported claims. The Company charges costs of claims, including the impact of changes in reserves due to claim experience and severity, to operations. The Company reviews and updates the amount of its insurance-related reserves on a quarterly basis. Environmental Liabilities the companhe reasonably estimated vine vormparas sessments and remediation activities in the period in which its responsibility is probable and records liabilities for The Company records , when recovery is probable. To the extent that the required remediation procedures change, or additional contamination is identified, the Company's estimated environmental liabilities may also change. See Note 20 for additional information. 52 Table of Contents MODINE MANUFACTURING COMPANY NOTES TO CONSOLIDATED FINANCIAL STATEMENTS (In millions, except per share amounts) 2019 - Supplemental Cash Flow Information Years ended March 31, 2021 2020 Interest paid 17.9 21.4 S 223 Income taxes paid 19.7 18.& 22.2 See Note 16 for supplemental cash flow information related to the Company's leases. New Accounting Guidance Adopted in Fiscal 2021 Endine 2016, the Financial Accounting Standards Board CFAB" issued guidance modifies the credit 1 Credit Losses assets, assets. The new guidance related to the access model to measure and rece credit for credit losses for financial losses based upon expected losses rather than incurred losses. The Company adopted this guidance as of April 1, 2020. The adoption did not have a material impact on the Company's consolidated balance sheets, statements of operations or statements of cash flows. New Accounting Guidance Adopted in Fiscal 2020 Intrebruary 2016, the FASB issued new comprehensive lease accounting guidance that requires balance sheet recognition for most leases. The Company adopted this guidance effective April 1, 2019 using a modified-retrospective transition method, under which it elected not to adjust comparative periods. The Company elected the package of practical expedients permitted under the new guidance and, as a result, the Company did not reassess the classification of existing leases or initial direct costs thereof, or whether existing contracts contain leases. In addition, the Company elected accounting policies to not record short-term leases on the balance sheet and to not separate lease and non-lease components. The Company did not elect the hindsight practical expedient Upon adoption toperating lease liabilities recognized right-of-use assets for 11, 2019, the $61.3 million and In addition, the Company assessed two existing build-to-suit arrangements, for which it had recorded property, plant and equipment and long-term debt on its consolidated balance corresponding current and on sheet as of March 31, 2019. The Company determined these arrangements represent operating leases under the new accounting guidance. As a result, the Company derecognized the previously-recorded balances and recorded $5.2 milliorf of operating lease right-of-use assets and corresponding lease liabilities. As a result of adopting the new guidance, there was not a significant impact on the Company's accounting for its previously-recorded capital leases, which are now classified as finance leases under the new guidance. In addition, there was no impact to retained Earnings. Also, the adoption did not have a material impact on the Company's consolidated statement of operations or consolidated Statement of cash flows. See Note 16 for additional information egarding the Company's teases. Wication detain Tax het vidance related to the accelera stranded income tax effects in accumulated other comprehensive income (loss) resulting from tax reform legislation that was enacted in the U.S. in December 2017. This guidance provided companies the option to reclassify stranded income tax effects to retained earnings. The Company adopted this guidance as of April 1, 2019 and chose not to reclassify stranded income tax effects; therefore, the adoption of this guidance did not impact the Company's consolidated financial statements. New Accounting Guidance Adopted in Fiscal 2019 Revenue Recognition In May 2014, the FASB issued new guidance that outlines a comprehensive model for entities to use in accounting for revenue arising from contracts with customers. The core principle of the new guidance is that companies are to recognize revenue to depict the transfer of goods or services to customers in an amount that reflects the consideration to which the entity expects to be entitled in exchange for those goods or services. The Company adopted this new guidance for fiscal 2019. using the modified-retrospective transition method. As a result of its adoption of the new guidance, the Company recorded an increase of $0.7 million to retained earnings as of April 1, 2018, along with related balance sheet feclassifications. See Note 3 for additional information regarding revenue recognition 53 Table of Contents MODINE MANUFACTURING COMPANY NOTES TO CONSOLIDATED FINANCIAL STATEMENTS (In millions, except per share amounts) In abovenitive On February 19, 2021, the Company signed a definitive agreement to sell its air-cooled automotive business to Schmid Metall GmbH. This transaction closed on April 30, 2021. Based upon its preliminary accounting, the Company expects to record a loss on sale of approximately $6.0 million during the first quarter of fiscal 2022. The estimated action include to the Dendrite of the liquid-cooleding capitar, as defined within the d for cash, debt, and automotive business, and concluded each represents a separate disposal group for purposes of assessing discontinued operations. The Company determined that the air-cooled disposal group did not qualify as a discontinued operation. The Company reports financial results of both the liquid- and air-cooled automotive businesses within its Automotive segment. Once the Company entered into the sale agreements with Board of Director approval, it classified the businesses as held for sale beginning on November 2, 2020 and February 19, 2021, respectively, and ceased depreciating the long-lived assets within the disposal groups. Upon classification as held for sale, the Company compared each disposal group's carrying value with its fair value, less costs to sell. Based upon the selling prices for each transaction, the Company estimated implied losses in excess of the respective carrying value of each disposal group's long-lived assets. The disposal groups' long-lived assets consist entirely of property, plant and equipment and right-of-se lease assets. As a result, the Company recorded non-cash impairment charges totaling $165.1 million during fiscal 2021 to reduce the net carrying value of the disposal groups' long-lived assets to zero. The impairment charges related to the liquid and air-cooled automotive businesses totaled $138.3 million and $26.8 million respectively. Also during fiscal 2021, the Company recorded an impairment charge of $1.7 million within the Automotive segment related to equipment that will not convey as part of the sale transactions and is not expected to be used within the Company's other businesses. These charges are reported within the impairmerit charges line on the consolidated statements of operations. 54 Table of Contents MO CONSOLIDA FACTURING COMPARTEMENTS NOTES (In millions, except per share amounts) The Company classified the assets and liabilities of the liquid- and air-cooled automotive businesses as held for sale on the March 31, 2021 consolidated balance sheet. The major classes of assets and liabilities held for sale were as follows: March 31, 2021 ASSETS 8.0 Cash and cash equivalents Trade accounts receivables - net 54.4 Inventories 24.7 Other current assets 12.8 Property, plant and equipment-net 164.0 8.8 Other noncurrent assets Impairment of carrying value Total assets held for sale 107. (1651 LIABILITIES Short-term debt Accounts payable Accrued compensation and employee benefits Other current liabilities Pensions Other noncurrent liabilities Total liabilities held for sale 520 46. 15.5 12.2 17.8 6.5 103.3 The Company will reassess the liquid-cooled disposal group's fair value less costs to sell at each reporting period that it is held for sale until the transaction is $20.01 $30.0 million upon transaction completion e recorded will be impacted by changes in working capital, costs to sell, nt actuarial ! related to the disposal group's pension plans, and cumulative translation adjustments. It is possible that the loss on sale recorded could differ materially from the Company's estimate Note 3: Revenue Recognition The Company generates revenue from selling innovative thermal management products and solutions to diversified global markets and customers. The Company recognizes revenue based upon consideration specified in a contract and as it satisfies performance obligations by transferring control over its products to its customers, which may be at a point in time or over time. The majority of the company's revenue is recognized at a point in time, based upon shipment terms. The Company records an allowance for credit losses and accrues for estimated warranty costs at the time of sale. These estimates are based basedi historical excosts shipping and handling a business trends.mance conditions. The accounts sa current Dumarate and current cons, and records shipping and handling costs in cost of sales and related amounts billed to customers in net sales. The Company establishes paynfent terms with its customers based upon industry and regional practices, which typically do not exceed 90 days. As the Company expects to receive payment from its customers within one year from the time of sale, it disregards the effects of the time value of money in its determination of the transaction price. The Company has not disclosed the value of unsatisfied performance obligations because the revenue associated with customer contracts for which the original expected performance period is greater than one year is immaterial. The following is a description of the Company's principal revenue-generating activities: Building HVAC Systems ("BHVAC" The BHVAC segment principally generates revenue from providing a variety of heating, ventilating, and air conditioning , products, primarily for Heating products are manufactured in the U.S. and are largely sold to independent distributors, who in turn market the heating products to end customers. Because these products are sold to many different customers without contractual or practical limitations, the BHVAC segment recognizes revenue at the time control is transferred to the customer, generally the independent distributor, based upon shipping terms, which is generally upon shipment 55 Table of Contents Table of Contents MODINE MANUFACTURING COMPANY NOTES TO CONSOLIDATED FINANCIAL STATEMENTS (In millions, except per share amounts) $ Disaggregation of Revenue The table below present revenue to external customers for each of the Company's business segments by primary end market, geographic location, and based upon the timing of revenue recognition: Year ended March 31, 2021 Segment BHVAC CIS HDE Automotive Total Primary end market: Commercial HVAC&R 181.6 420.6 602.2 Data center cooling 58.7 47.3 106.0 Industrial cooling 55.4 55.4 Commercial vehicle 250.4 14.4 264.8 Off-highway 260.7 3.4 264.1 Automotive and light vehicle 97.9 357.8 455.7 Other 03 8.7 73.1 22.2 104.8 Net sales 240.6 532.0 682-1 398.3 1,853.0 Geographic location: Americas 144.2 $ 26747 $ 388.2 51.0 $ 851.1 Europe 96.4 219.8 133.2 282.0 731.4 Asia 44.5 160.7 65.3 270.5 Net sales 240.6 532.0 682.1 398.3 $ 1,853,0 Timing of revenue recognition: Products transferred at a point in time 240.6 $ 486.3 655.2 $ 398.3 $ 1.780.4 Products transferred over time 45.7 26.9 72.6 Net sales 240.6 532.0 682.1 398.3 1,853.0 Year ended March 31, 2020 BHVAC CIS HDE Automotive Segment fotal 176.6 42.7 $ $ 4631 107.5 43,5 302.1 240.8 108.4 94.6 745.9 21.6 13.1 400.4 9.8 444.9 639.7 150,2 43.5 323.7 253.9 508.8 116.0 2,035,8 1.8 221.1 9.8 623.9 $ Primary end market: Commercial HVAC&R Data center cooling Industrial cooling Commercial vehicle Off-highway Automotive and light vehicle Other Net sales Geographic location: Americas Europe Asia Net sales Timing of revenue recognition: Products transferred at a point in time Products transferred over time Net sales $ 139.1 82.0 $ $ 345.9 232.6 4514 623.9 484.5 141.2 120.2 745.9 70.3 321.0 53.6 1,039.8 776.8 219.2 2,035.8 22111 22111 $ $ 4449 518.2 105.7 623.9 715.1 30.8 745.9 1,899.3 136,5 2,035.8 221.1 444.9 57 Table of Contents MODINE MANUFACTURING COMPANY MOTORY 1 ITATI ANTATTI Table of Contents $ $ MODINE MANUFACTURING COMPANY NOTES TO CONSOLIDATED FINANCIAL STATEMENTS (In millions, except per share amounts) Year ended March 31, 2019 Segment BHVAC CIS HDE Automotive Total Primary end market: Commercial HVAC&R 167.7 506.3 674.0 Data center cooling 41.3 145.7 187.0 Industrial cooling 47.8 47.8 Commercial vehicle 3526 35.0 387.6 Off-highway 298.1 16.0 314.1 Automotive and light vehicle 116.7 426.1 542.8 Other 3.4 7.8 104.9 11.8 127.9 Net sales 21124 707.6 872.3 488.9 2,281.2 Geographic location: Americas 124.9 413.6 $ 543.0 71.0 1,152.5 Europe 87.5 244.8 1774 369.4 879.1 Asia 49.2 151.9 48.5 249.6 Net sales 212.4 707.6 872.3 488.9 2,281.2 Timing of revenue recognition: Products transferred at a point in time 212.4 $ 571.1 $ 829.1 488.9 2,101.5 Products transferred over time 136.5 43.2 179.7 Net sales 2124 707.6 872.3 488,9 2,281.2 Contract Balances Contract assets and contract liabilities from contracts with customers were as follows: March 31, 2021 March 31, 2020 Contract assets $ 5.7 $ 21.7 Contract liabilities 5.6 5.6 At March 31, 2021, contract assets and contract liabilities exclude amounts classified as held for sale. See Note 2 for additional information. Contract assets, included within other current assets in the consolidated balance sheets, primarily consist of capitalized costs related to customer- owned tooling contracts, wherein the customer has guaranteed reimbursement, and assets recorded for revenue recognized over time, which represent the Company's rights to consideration for work completed but not yet billed. The $16.0 million decrease in contract assets during fiscal 2021 primarily resulted from a decrease in contract assets for revenue recognized over time and $7.1 million of contract assets within the liquid and air- cooled automotive businesses that have been classified as held for sale on the March 31, 2021 consolidated balance sheet. Contract liabilities, included within other current liabilities in the consolidated balance sheets, consist of payments received in advance of satisfying performance obligations under customer contracts, including contracts for customer-owned tooling. During fiscal 2021, increases related to customer contracts for which payment was received in advance of the Company's satisfaction of performance obligations was offset by $2.9 million of contract liabilities within the liquid- and air-cooled automotive businesses that have been classified as held for sale on the March 31, 2021 consolidated balance sheet. Note 4: Fair Value Measurements Fair value is defined as the price that would be received for an asset or paid to transfer a liability in the principal or most advantageous market for the asset or liability in an orderly transaction between market participants. Fair value measurements are classified under the following hierarchy: : Level 1 - Quoted prices for identical instruments in active markets. Level 2 - Quoted prices for similar instruments in active markets, quoted prices for identical or similar instruments in markets that are not active and model-derived valuations in which all significant inputs are observable in active markets. Level 3 - Model-derived valuations in which one or more significant inputs are not observable. . 58 withdrawals during fiscal 2021. Plan assets related to the Company's pension plans were classified as follows: Level 1 March 31, 2021 Level 2 Total $ 2.5 8.9 S 37.3 Money market investments Fixed income securities Pooled equity funds U.S. government and agency securities Other Fair value excluding investments measured at net asset value Investments measured at net asset value Total fair value 0.11 37.4 14.5 1.0 26.9 25 8.9 37.3 14.5 1.1 64.3 119.0 1833 Level March 31, 2020 Level 2 Total 2.4 s 8.7 17.9 Money market investments Fixed income securities Pooled equity funds U.S. government and agency securities Other Fair value excluding investment measured at net asset value Investments measured at net asset value Total fair value 0.1 18.0 13.1 0.7 24.9 2.4 8.7 17.9 13.1 0.8 42.9 88.2 131.1 S The Company determined the fair value of money market investments to approximate their net asset values, without discounts for credit quality or liquidity restrictions, and classified them within Level 2 of the valuation hierarchy. The Company determined the fair value of pooled equity funds based upon quoted prices from active markets and classified them within Level 1 of the valuation hierarchy. The Company determined the fair value of fixed income securities and U.S. government and agency securities based upon recent bid prices or the average of recent bid and asking prices when available and, if not available, the Company valued them through matrix pricing models developed by sources considered by management to 3 assets within its pension plans. be reliable. The Company classified these assets within Level 2 of the valuation hierarchy. As of March 31, 2021 and 2020, the Company held no Level 59 Table of Contents MODINE MANUFACTURING COMPANY NOTES TO CONSOLIDATED FINANCIAL STATEMENTS (In millions, except per share amounts) As a practical expedient, the Company valued certain investments, including pooled equ
Step by Step Solution
There are 3 Steps involved in it

Get step-by-step solutions from verified subject matter experts