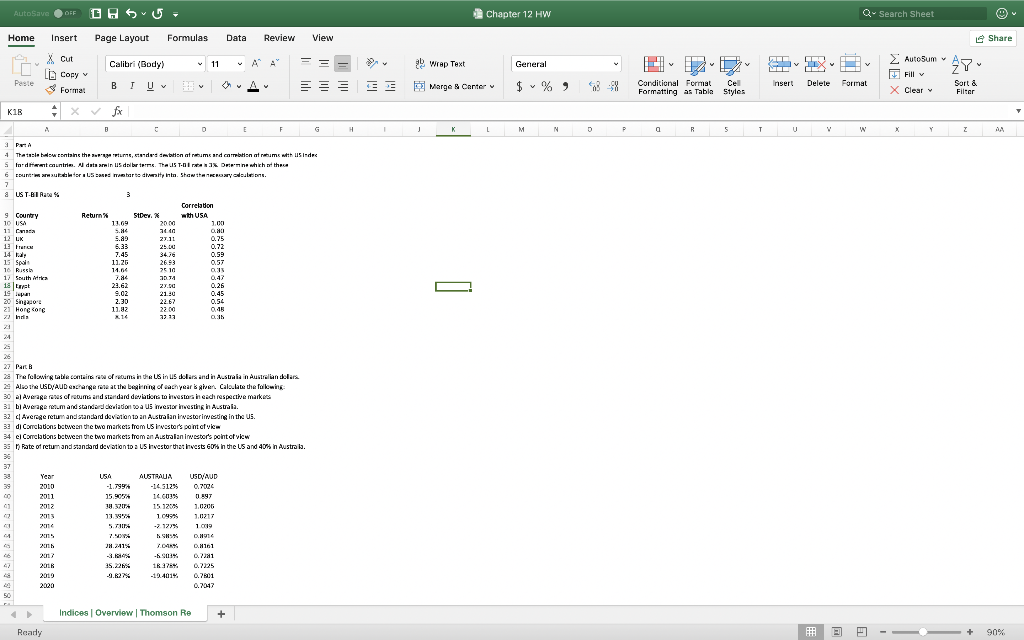
 Please complete Part A & B, showing the calculations and excel formulas to do so.
AutoSave OFF OFF COSU Chapter 12 HW Q- Search Sheet Home Insert Page Layout Formulas Data Review View Share Calibri (Body) 11 Autosum General a wrap Text F P v Hv X Cut in Copy v Format 27 Fill v Paste B 4 ===== I U U Insert $% Delete Format Marge & Carter Conditional Format Cel Formatting as Table Styles X Clear Sort & Filter KIR + x fx T 1 J K L M N D P 5 T U v W x Y Z A B D F G 3 PIA 1 Thatost below contains the returne, cindere debton at rums and correbon at nabums with sides Stadtentountries. Al data rin LIS dalbertons. The IS T-DIX Drine which them 6 EU utor US Started matteint. Stawiankoydutos. Inn. 7 8 UST.BIRD 3 Correlation 9 Country Returns StDev. with USA 10 USA 13.69 an 1.00 11 CM 5.84 200 0.80 12 UK 27.11 0.75 Frame 6.33 0.72 14 y 7.45 34.76 059 15 Spil 11.26 263 057 16 RIKO 146 10 pe 10 1 12 South 7.84 with .... 3 74 042 18 lat 0.26 1s 3.04 9.02 21.10 0.45 20 Scot 2.30 054 21 Horcon 11.82 2200 0.45 2) Indis 214 Oh 21 24 S - 26 27 Part B Trefclowing table contato com crumita in the US in US dollars and in Australia in Australian dollars 2 Alroth USDYAUD estrangere at the beginning of each year gier Calolate the following 30 Average rates of count and standard deviation to investoineadh respecte markers 31 bj Average mom and standard deviation to a US westor investing in Australa. 32 Average retum and standard deviation to an Australan investerincing in the US. 33 di Corclations between the two markets from US investor's point of view 34 cl Corclations between the two markets from an Australian inwestor's point of viw 35 ) Rate of retum and standard deviation to a US Investor that invest in the US and 404 in Austra. 30 37 38 Year USA AUSTRALA 39 2010 -1.799 -14 512% 07024 2011 15.9034 14 603% SYT 09 2012 15.125% 201200 2015 13. 10999 9.01217 CI 2014 -2 123% 10719 0.1914 2h JH21% L. DAN D.H11 26 2017 - 90% 0.22 47 2018 35.22% 18924. 0.2225 49 2319 -19.4014, 0.7601 2 2020 0.7012 50 USDAUD Indices Overview Thomson Re + Ready + 90% % AutoSave OFF OFF COSU Chapter 12 HW Q- Search Sheet Home Insert Page Layout Formulas Data Review View Share Calibri (Body) 11 Autosum General a wrap Text F P v Hv X Cut in Copy v Format 27 Fill v Paste B 4 ===== I U U Insert $% Delete Format Marge & Carter Conditional Format Cel Formatting as Table Styles X Clear Sort & Filter KIR + x fx T 1 J K L M N D P 5 T U v W x Y Z A B D F G 3 PIA 1 Thatost below contains the returne, cindere debton at rums and correbon at nabums with sides Stadtentountries. Al data rin LIS dalbertons. The IS T-DIX Drine which them 6 EU utor US Started matteint. Stawiankoydutos. Inn. 7 8 UST.BIRD 3 Correlation 9 Country Returns StDev. with USA 10 USA 13.69 an 1.00 11 CM 5.84 200 0.80 12 UK 27.11 0.75 Frame 6.33 0.72 14 y 7.45 34.76 059 15 Spil 11.26 263 057 16 RIKO 146 10 pe 10 1 12 South 7.84 with .... 3 74 042 18 lat 0.26 1s 3.04 9.02 21.10 0.45 20 Scot 2.30 054 21 Horcon 11.82 2200 0.45 2) Indis 214 Oh 21 24 S - 26 27 Part B Trefclowing table contato com crumita in the US in US dollars and in Australia in Australian dollars 2 Alroth USDYAUD estrangere at the beginning of each year gier Calolate the following 30 Average rates of count and standard deviation to investoineadh respecte markers 31 bj Average mom and standard deviation to a US westor investing in Australa. 32 Average retum and standard deviation to an Australan investerincing in the US. 33 di Corclations between the two markets from US investor's point of view 34 cl Corclations between the two markets from an Australian inwestor's point of viw 35 ) Rate of retum and standard deviation to a US Investor that invest in the US and 404 in Austra. 30 37 38 Year USA AUSTRALA 39 2010 -1.799 -14 512% 07024 2011 15.9034 14 603% SYT 09 2012 15.125% 201200 2015 13. 10999 9.01217 CI 2014 -2 123% 10719 0.1914 2h JH21% L. DAN D.H11 26 2017 - 90% 0.22 47 2018 35.22% 18924. 0.2225 49 2319 -19.4014, 0.7601 2 2020 0.7012 50 USDAUD Indices Overview Thomson Re + Ready + 90% %