Please complete the below table:
Balance sheet added, don't worry about CAGR for 2014, just put N/A.
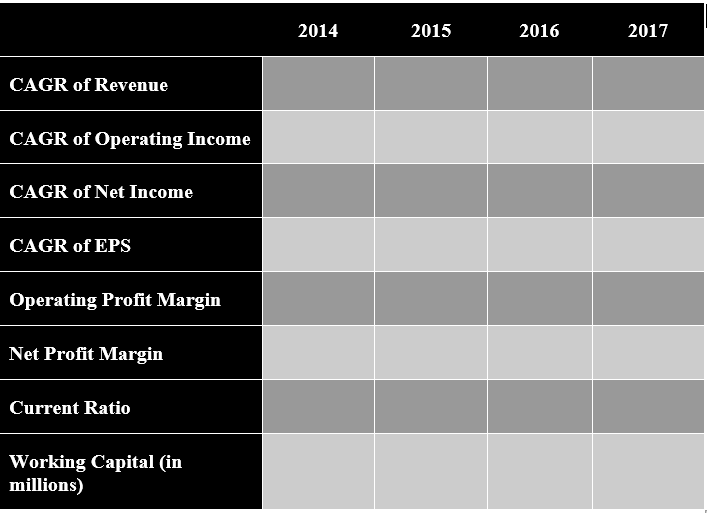
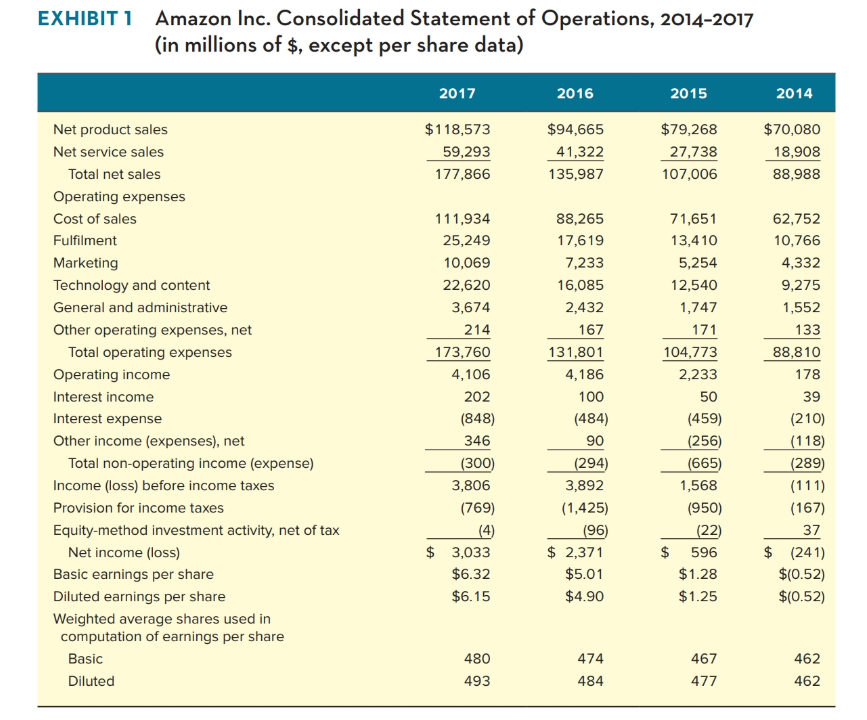
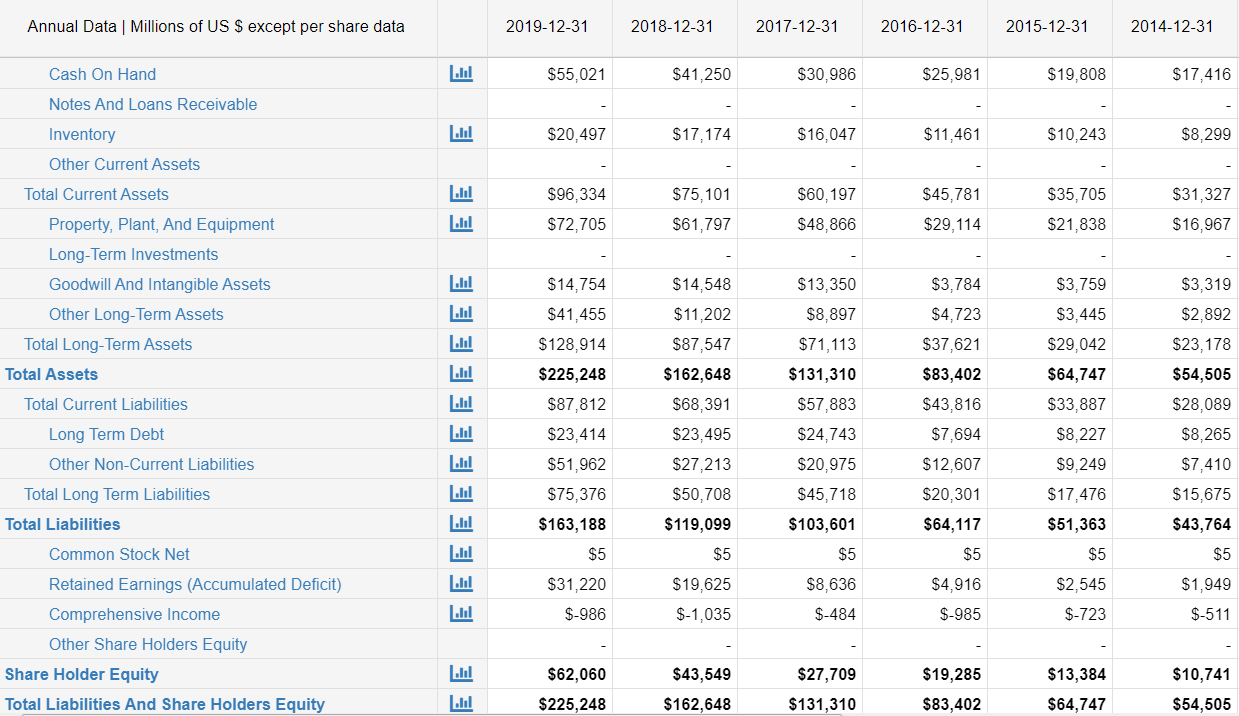
2014 2015 2016 2017 CAGR of Revenue CAGR of Operating Income CAGR of Net Income CAGR of EPS Operating Profit Margin Net Profit Margin Current Ratio Working Capital (in millions) EXHIBIT 1 Amazon Inc. Consolidated Statement of Operations, 2014-2017 (in millions of $, except per share data) 2017 2016 2015 2014 $118,573 59,293 177,866 $94,665 41,322 135,987 $79,268 27,738 107,006 $70,080 18,908 88,988 111,934 25,249 10,069 22,620 3,674 214 173,760 4,106 202 (848) 346 (300) 3,806 (769) 88,265 17,619 7,233 16,085 2,432 167 131,801 4,186 71,651 13,410 5,254 12,540 1,747 171 104,773 2,233 Net product sales Net service sales Total net sales Operating expenses Cost of sales Fulfilment Marketing Technology and content General and administrative Other operating expenses, net Total operating expenses Operating income Interest income Interest expense Other income (expenses), net Total non-operating income (expense) Income (loss) before income taxes Provision for income taxes Equity-method investment activity, net of tax Net income (loss) Basic earnings per share Diluted earnings per share Weighted average shares used in computation of earnings per share Basic Diluted 62,752 10,766 4,332 9,275 1,552 133 88,810 178 100 39 (484) 90 (294) 3,892 (1,425) (96) $ 2,371 $5.01 $4.90 (459) (256) (665) 1,568 (950) (22) 596 $1.28 $1.25 (210) (118) (289) (111) (167) 37 $ $ $ 3,033 $6.32 $6.15 (241) $(0.52) $(0.52) 480 493 474 484 467 477 462 462 Annual Data Millions of US $ except per share data 2019-12-31 2018-12-31 2017-12-31 2016-12-31 2015-12-31 2014-12-31 $55,021 $41,250 $30,986 $25,981 $19,808 $17,416 $20,497 $17,174 $16,047 $11,461 $10,243 $8,299 Cash On Hand Notes And Loans Receivable Inventory Other Current Assets Total Current Assets Property, Plant, And Equipment Long-Term Investments Goodwill And Intangible Assets Other Long-Term Assets Total Long-Term Assets Total Assets $96,334 $72,705 $75, 101 $61,797 $60,197 $48,866 $45,781 $29,114 $35,705 $21,838 $31,327 $16,967 EEE EE E $14,548 $11,202 $87,547 $162,648 $68,391 $13,350 $8,897 $71,113 $131,310 Total Current Liabilities $14,754 $41,455 $128,914 $225,248 $87,812 $23,414 $51,962 $75,376 $163,188 $5 $31,220 $-986 $3,784 $4,723 $37,621 $83,402 $43,816 $7,694 $12,607 $20,301 $64,117 $23,495 $3,759 $3,445 $29,042 $64,747 $33,887 $8,227 $9,249 $17,476 $51,363 Long Term Debt Other Non-Current Liabilities Total Long Term Liabilities Total Liabilities $57,883 $24,743 $20,975 $45,718 $103,601 $5 $8,636 | lil $3,319 $2,892 $23,178 $54,505 $28,089 $8,265 $7,410 $15,675 $43,764 $5 $1,949 $-511 $27,213 $50,708 $119,099 $5 $19,625 $-1,035 $5 $5 $4,916 $-985 $2,545 $-723 $-484 Common Stock Net Retained Earnings (Accumulated Deficit) Comprehensive Income Other Share Holders Equity Share Holder Equity Total Liabilities And Share Holders Equity $62,060 $225,248 $43,549 $162,648 $27,709 $131,310 $19,285 $83,402 $13,384 $64,747 $10,741 $54,505 2014 2015 2016 2017 CAGR of Revenue CAGR of Operating Income CAGR of Net Income CAGR of EPS Operating Profit Margin Net Profit Margin Current Ratio Working Capital (in millions) EXHIBIT 1 Amazon Inc. Consolidated Statement of Operations, 2014-2017 (in millions of $, except per share data) 2017 2016 2015 2014 $118,573 59,293 177,866 $94,665 41,322 135,987 $79,268 27,738 107,006 $70,080 18,908 88,988 111,934 25,249 10,069 22,620 3,674 214 173,760 4,106 202 (848) 346 (300) 3,806 (769) 88,265 17,619 7,233 16,085 2,432 167 131,801 4,186 71,651 13,410 5,254 12,540 1,747 171 104,773 2,233 Net product sales Net service sales Total net sales Operating expenses Cost of sales Fulfilment Marketing Technology and content General and administrative Other operating expenses, net Total operating expenses Operating income Interest income Interest expense Other income (expenses), net Total non-operating income (expense) Income (loss) before income taxes Provision for income taxes Equity-method investment activity, net of tax Net income (loss) Basic earnings per share Diluted earnings per share Weighted average shares used in computation of earnings per share Basic Diluted 62,752 10,766 4,332 9,275 1,552 133 88,810 178 100 39 (484) 90 (294) 3,892 (1,425) (96) $ 2,371 $5.01 $4.90 (459) (256) (665) 1,568 (950) (22) 596 $1.28 $1.25 (210) (118) (289) (111) (167) 37 $ $ $ 3,033 $6.32 $6.15 (241) $(0.52) $(0.52) 480 493 474 484 467 477 462 462 Annual Data Millions of US $ except per share data 2019-12-31 2018-12-31 2017-12-31 2016-12-31 2015-12-31 2014-12-31 $55,021 $41,250 $30,986 $25,981 $19,808 $17,416 $20,497 $17,174 $16,047 $11,461 $10,243 $8,299 Cash On Hand Notes And Loans Receivable Inventory Other Current Assets Total Current Assets Property, Plant, And Equipment Long-Term Investments Goodwill And Intangible Assets Other Long-Term Assets Total Long-Term Assets Total Assets $96,334 $72,705 $75, 101 $61,797 $60,197 $48,866 $45,781 $29,114 $35,705 $21,838 $31,327 $16,967 EEE EE E $14,548 $11,202 $87,547 $162,648 $68,391 $13,350 $8,897 $71,113 $131,310 Total Current Liabilities $14,754 $41,455 $128,914 $225,248 $87,812 $23,414 $51,962 $75,376 $163,188 $5 $31,220 $-986 $3,784 $4,723 $37,621 $83,402 $43,816 $7,694 $12,607 $20,301 $64,117 $23,495 $3,759 $3,445 $29,042 $64,747 $33,887 $8,227 $9,249 $17,476 $51,363 Long Term Debt Other Non-Current Liabilities Total Long Term Liabilities Total Liabilities $57,883 $24,743 $20,975 $45,718 $103,601 $5 $8,636 | lil $3,319 $2,892 $23,178 $54,505 $28,089 $8,265 $7,410 $15,675 $43,764 $5 $1,949 $-511 $27,213 $50,708 $119,099 $5 $19,625 $-1,035 $5 $5 $4,916 $-985 $2,545 $-723 $-484 Common Stock Net Retained Earnings (Accumulated Deficit) Comprehensive Income Other Share Holders Equity Share Holder Equity Total Liabilities And Share Holders Equity $62,060 $225,248 $43,549 $162,648 $27,709 $131,310 $19,285 $83,402 $13,384 $64,747 $10,741 $54,505