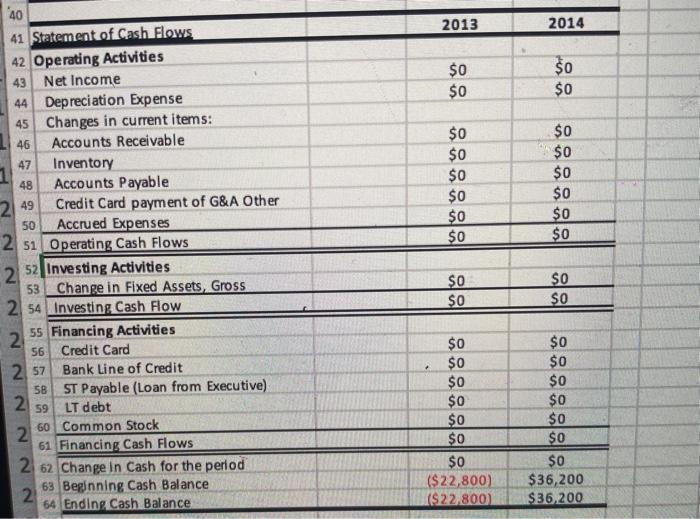
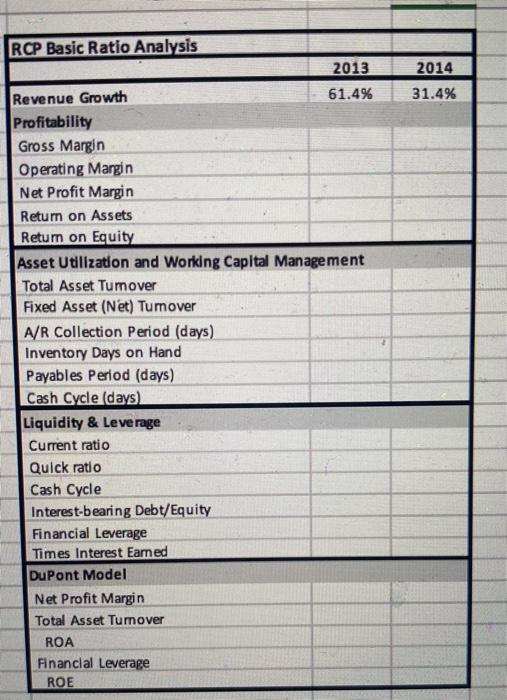
Please complete the Cash Flow Statement for both years and do the ratio analysis as well. Both the Income Statement and Balance Sheet are provided so you can do both the ratios and cash flow.
Please complete the Cash Flow Statement (picture 2) for both years and do the ratio analysis (picture 3) as well. Both the Income Statement and Balance Sheet are provided on Image 1, so you can do both the ratios and cash flow.
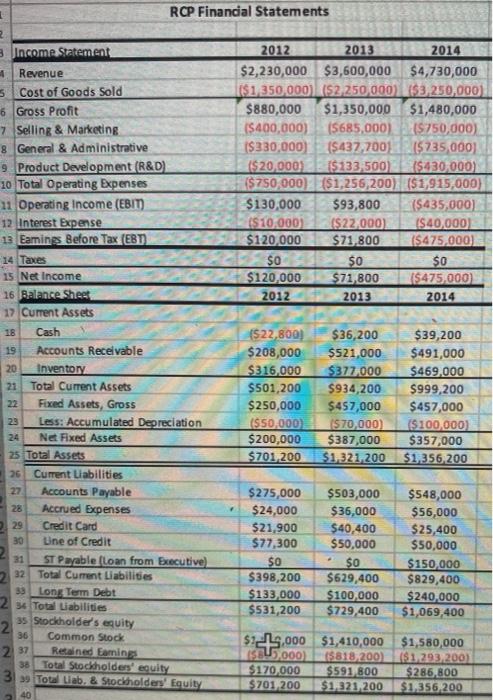
RCP Financial Statements 2014 2012 $2.230,000 $1,350,000 5880,000 15400,000) 15330,000) (530,0001 {$750.000) $130,000 ($10,000) $120,000 $0 $120.000 2012 2013 $3,600,000 (52.250,000) $1.350.000 (S65.000 (5437,700 ($133.500) ($1,256,200) $93.800 {$22.000) $71.800 so $71.800 2013 2014 $4,790,000 153.250,0001 $1.480,000 (5750,000) 15735.000 (5430,000) ($1.915.000 15435.000 (540.000) (5475,000) $0 15475,000 2014 Income Statement Revenue Cost of Goods Sold Gross Profit Selling & Marketing General & Administrative Product Development (R&D) Total Operating Expenses Operating Income (BIT) Interest Expense Earnings Before Tex (EBT) Taxes Net Income Balance Shest Current Assets Cash Accounts Receivable Inventory Total Current Assets Fixed Assets, Gross Less: Accumulated Depreciation Net Fixed Assets Total Assets Current Liabilities Accounts Payable Accrued Expenses Credit Card Line of Credit ST Payable (Lean from Executive) Total Current Liabilities Long Term Debe Total Liabilities Stockholder's equity Common Stock Retained Earnings Total Stockholders' equity Total Liab. & Stockholders' Equity RCP Basic Ratio Analysis 2013 Revenue Growth 61.4% Profitability Gross Margin Operating Margin Net Profit Margin Return on Assets Retum on Equity Asset Utilization and Working Capital Management Total Asset Turnover Fixed Asset (Net) Tumover AR Collection Period (days) Inventory Days on Hand Payables Period (days) Cash Cycle (days) Liquidity & Leverage Current ratio Quick ratio Cash Cycle Interest-bearing Debt Equity Financial Leverage Times Interested DuPont Model Net Profit Marcin Total Asset Turnover ROA Financial Leverage ROE (522,00 S208,000 $316,000 $5012 $250,000 ($50,000) $200,000 $701,200 $36.200 SS21.000 $377.000 $934.200 $457.000 (570.000) SUR7.000 $1,321,200 $39,200 $491,000 $469,000 $999 200 S457,000 (S100,000) 5357,000 $1.356,200 $275,000 $24,000 $21.900 577.300 SO $398.200 $133.000 S531.200 $50.000 536.000 $40,400 $50,000 SO $629.400 $100,000 5729.400 S548.000 $56,000 525,400 $50,000 SISO,000 5829,400 $240,000 $1.009.400 $1,060,000 1590,000) $170,000 5701.200 $1.410,000 ($18.2003 3391.500 $1.321.200 $1,580,000 151.293.2001 $286,800 SI.356,200 2013 2014 SO SO SO SO 89.8888 Statement of Cash Flows Operating Activities Net Income Depreciation Expense Changes in current items Accounts Receivable Inventory Accounts Payable Credit Card payment of G&A Other Accrued Expenses Operating Cash Flows Investing Activities Change in Fixed Assets, Gross Investing Cash Flow Financing Activities Credit Card Bank Line of Credit ST Payable (Lean from Executive) LT debi Common Stock Financing Cash Flows Change in Cash for the period Beginning Cash Balance Ending Cash Balance SO SO $0 SO SSSSSSS SSSSSSS (522.00) ($22.800) SO $36,200 $36,200 1 RCP Financial Statements 2012 2013 2014 $2,230,000 $3,600,000 $4,730,000 ($1350,000 $2,250,000 $3,250,000) $880,000 $1,350,000 $1,480,000 (5400,000) 15685,000) {$750,000) 1$330,000) 1$437,700 (5735,000) ($20,000) ($133,500) ($430,000) $750,000). {$1,256,200) ($1,915,000) $130,000 $93,800 ($435,000) ($10,000) {$22.000 (S40,000) $120,000 $71,800 ($475,000) $0 50 $0 $120,000 $71 800 $475,000 2012 2013 2014 2 3 Income Statement Revenue 5 Cost of Goods Sold 6 Gross Profit 7 Selling & Marketing 8 General & Administrative 9 Product Development (R&D) 10 Total Operating Expenses 11 Operating Income (EBIT) 12 Interest Expense 13 Eamins Before Tax (EBT 14 Taxes 15 Net Income 16 Balance Sheet 17 Cument Assets 18 Cash 19 Accounts Receivable 20 Inventory 21 Total Current Assets 22 Fixed Assets, Gross 23 Less: Accumulated Depreciation 24 Ne Fixed Assets 25 Total Assets 26 Current Liabilities 27 Accounts Payable Accrued Expenses 29 Credit Card 30 Une of Credit 31 ST Payable floan from Executive) 32 Total Current Liabilities 30 Long Term Debt 2 Total abilities 2 35 Stockholder's equity 36 Common Stock Retained Emines 38 Total Stockholders' equity 3 Totenb. & Stockholders Equity (522,800) $208,000 $316,000 $501,200 $250,000 ($50,000 $200,000 $701 200 $36,200 $521,000 $377.000 $934,200 $457,000 1$70,000) $387,000 $1.321,200 $39,200 $491,000 $469.000 $999,200 $457,000 $100,000) $357,000 $1356200 . $275,000 $24,000 521,900 $77,300 $0 $398,200 $133,000 $531,200 $503,000 $36,000 $40,400 $50,000 $0 $629,400 $100,000 $729,400 $548,000 $56,000 $25,400 $50,000 $150,000 $829,400 $240,000 $1,069,400 2 37 $13,000 SU5.000 $170,000 $701,200 $1,410,000 $1,580,000 ($818 200) ($1.293.200) $591 800 $286,800 $1,321,200 $1,356,200 2013 2014 $0 $0 so $0 $0 $0 $0 $0 $0 $0 $0 $0 $0 $0 $0 $0 40 41 Statement of Cash Flows 42 Operating Activities 43 Net Income 44 Depreciation Expense 45 Changes in current items: 46 Accounts Receivable 47 Inventory 48 Accounts Payable 249 Credit Card payment of G&A Other 50 Accrued Expenses 2 si Operating Cash Flows 2 52 Investing Activities 53 Change in Fixed Assets, Gross 2 54 Investing Cash Flow 2. 55 Financing Activities 56 Credit Card 257 Bank Line of Credit 5B ST Payable (Loan from Executive) 2 59 LT debt 2 60 Common Stock 61 Financing Cash Flows 2 62 Change in Cash for the period 2 63 Beginning Cash Balance 64 Endin, Cash Balance $0 $0 $0 $0 2. 2 $0 $0 $0 $0 $0 $0 $0 ($ 22,800) ($22.800 $0 $0 $0 $o $0 $0 $0 $36,200 $36,200 2014 31.4% RCP Basic Ratio Analysis 2013 Revenue Growth 61.4% Profitability Gross Margin Operating Margin Net Profit Margin Retum on Assets Return on Equity Asset Utilization and Working Capital Management Total Asset Tumover Fixed Asset (Net) Tumover A/R Collection Period (days) Inventory Days on Hand Payables Period (days) Cash Cycle (days) Liquidity & Leverage Current ratio Quick ratio Cash Cycle Interest-bearing Debt/Equity Financial Leverage Times Interest Eamed DuPont Model Net Profit Margin Total Asset Tumover ROA Financial Leverage ROE