Please complete this in excel with formulas listed kindly. Thank you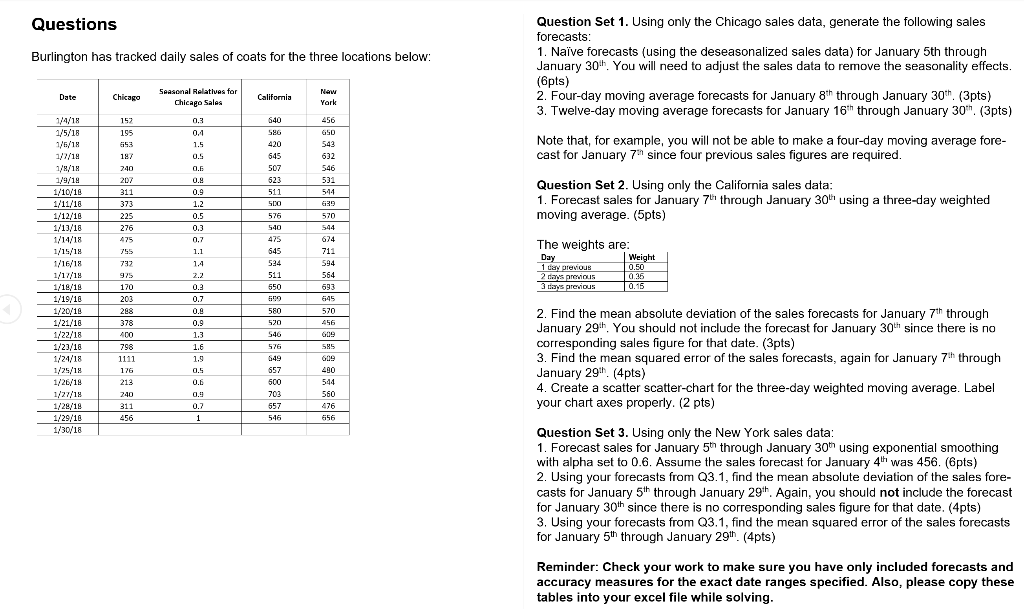
Questions Burlington has tracked daily sales of coats for the three locations below: Question Set 1. Using only the Chicago sales data, generate the following sales forecasts: 1. Naive forecasts (using the deseasonalized sales data) for January 5th through January 30h. You will need to adjust the sales data to remove the seasonality effects. (6pts) 2. Four-day moving average forecasts for January 8 through January 30 (3pts) 3. Twelve-day moving average forecasts for January 16 through January 30 (3pts) New Date Chicago Seasonal Relatives for Chicago Sales California York 152 540 155 420 Note that, for example, you will not be able to make a four-day moving average fore- cast for January 7 since four previous sales figures are required. 182 0.5 311 0.9 511 37 225 Question Set 2. Using only the California sales data: 1. Forecast sales for January 7 through January 300 using a three-day weighted moving average. (5pts) 576 1/4/18 1/5/18 1619 12/19 1/9/12 1/9/19 1/10/16 1/11/18 1/12/16 1/13/18 1/14/18 1/15/18 1/16/18 1/17/14 1/18/19 1/19/10 1/20/18 1/21/18 1/22/18 475 0.2 425 545 Day 712 1.4 594 The weights are: Weight 1 tay previous 10.50 2 days previous 106 3 rays previous 10.15 564 511 550 120 0.2 693 203 0,2 268 0.8 580 570 546 400 798 1111 2. Find the mean absolute deviation of the sales forecasts for January 7th through January 29, You should not include the forecast for January 30th since there is no corresponding sales figure for that date. (3pts) 3. Find the mean squared error of the sales forecasts, again for January 7th through January 29th (4pts) 4. Create a scatter scatter-chart for the three-day weighted moving average. Label your chart axes properly. (2 pts) 0,5 557 480 1/24/18 1/25/18 1/26/18 1/27/18 1/28/18 1/29/16 1/30/18 500 240 560 0,9 0.2 311 256 557 546 656 Question Set 3. Using only the New York sales data: 1. Forecast sales for January 5 through January 30h using exponential smoothing with alpha set to 0.6. Assume the sales forecast for January 4th was 456. (pts) 2. Using your forecasts from Q3.1, find the mean absolute deviation of the sales fore- casts for January 5th through January 29. Again, you should not include the forecast for January 30" since there is no corresponding sales figure for that date. (4pts) 3. Using your forecasts from Q3.1, find the mean squared error of the sales forecasts for January 5 through January 29 (4pts) Reminder: Check your work to make sure you have only included forecasts and accuracy measures for the exact date ranges specified. Also, please copy these tables into your excel file while solving. Questions Burlington has tracked daily sales of coats for the three locations below: Question Set 1. Using only the Chicago sales data, generate the following sales forecasts: 1. Naive forecasts (using the deseasonalized sales data) for January 5th through January 30h. You will need to adjust the sales data to remove the seasonality effects. (6pts) 2. Four-day moving average forecasts for January 8 through January 30 (3pts) 3. Twelve-day moving average forecasts for January 16 through January 30 (3pts) New Date Chicago Seasonal Relatives for Chicago Sales California York 152 540 155 420 Note that, for example, you will not be able to make a four-day moving average fore- cast for January 7 since four previous sales figures are required. 182 0.5 311 0.9 511 37 225 Question Set 2. Using only the California sales data: 1. Forecast sales for January 7 through January 300 using a three-day weighted moving average. (5pts) 576 1/4/18 1/5/18 1619 12/19 1/9/12 1/9/19 1/10/16 1/11/18 1/12/16 1/13/18 1/14/18 1/15/18 1/16/18 1/17/14 1/18/19 1/19/10 1/20/18 1/21/18 1/22/18 475 0.2 425 545 Day 712 1.4 594 The weights are: Weight 1 tay previous 10.50 2 days previous 106 3 rays previous 10.15 564 511 550 120 0.2 693 203 0,2 268 0.8 580 570 546 400 798 1111 2. Find the mean absolute deviation of the sales forecasts for January 7th through January 29, You should not include the forecast for January 30th since there is no corresponding sales figure for that date. (3pts) 3. Find the mean squared error of the sales forecasts, again for January 7th through January 29th (4pts) 4. Create a scatter scatter-chart for the three-day weighted moving average. Label your chart axes properly. (2 pts) 0,5 557 480 1/24/18 1/25/18 1/26/18 1/27/18 1/28/18 1/29/16 1/30/18 500 240 560 0,9 0.2 311 256 557 546 656 Question Set 3. Using only the New York sales data: 1. Forecast sales for January 5 through January 30h using exponential smoothing with alpha set to 0.6. Assume the sales forecast for January 4th was 456. (pts) 2. Using your forecasts from Q3.1, find the mean absolute deviation of the sales fore- casts for January 5th through January 29. Again, you should not include the forecast for January 30" since there is no corresponding sales figure for that date. (4pts) 3. Using your forecasts from Q3.1, find the mean squared error of the sales forecasts for January 5 through January 29 (4pts) Reminder: Check your work to make sure you have only included forecasts and accuracy measures for the exact date ranges specified. Also, please copy these tables into your excel file while solving