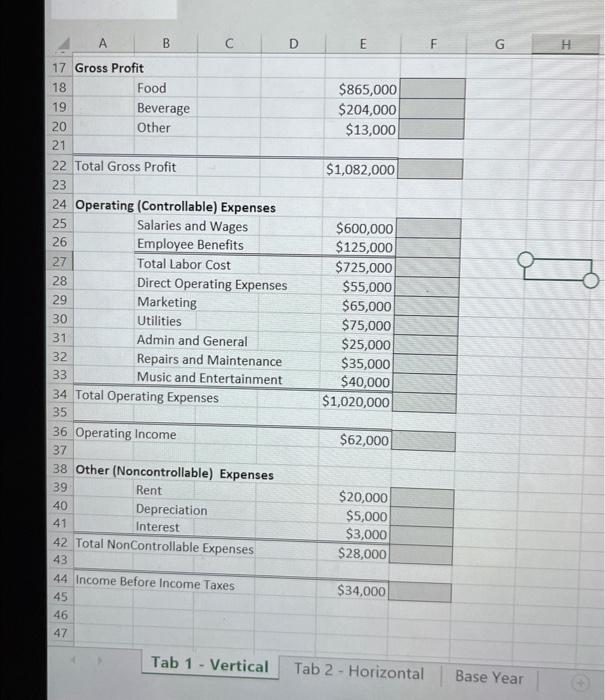
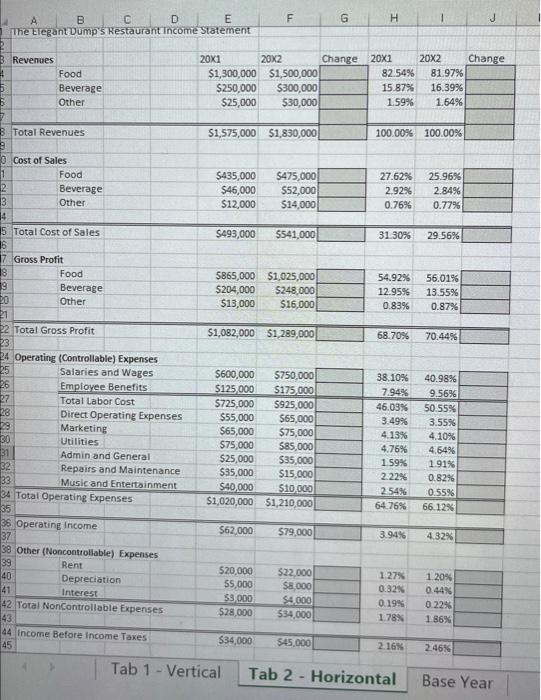
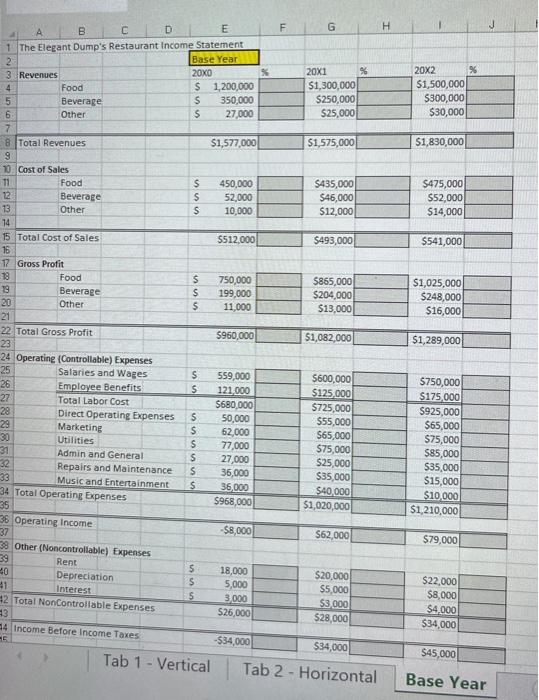
please complete vertical analysis for the first 2 pictures, horizontal for the next picture, and a comparison analysis for the last picture. Thank you
Tab 1 - Vertical Tab 2-Horizontal Base Year Other (Noncontrollable) Expenses 46 47 \begin{tabular}{l|l|l|l} Tab 1 - Vertical & Tab 2-Horizontal Base Year \end{tabular} \begin{tabular}{|l|r|r|r|r|r|r|} \hline Revenues & 201 & 202 & Change & 201 & 202 & Change \\ \hline Food & $1,300,000 & $1,500,000 & & 82.54% & 81.97% & \\ \hline Beverage & $250,000 & 5300,000 & & 15.87% & 16.39% & \\ \hline Other & $25,000 & 530,000 & & 1.59% & 1.64% & \\ \hline & & & & & & \\ \hline Total Revenues & $1,575,000 & 51,830,000 & & 100.00% & 100.00% & \\ \hline \end{tabular} Cost of Sales \begin{tabular}{|l|l|l|l|l|l|} \hline Total Cost of Sales & $493,000 & 5541,000 & 31.30% & 29.56% & \\ \hline \end{tabular} Gross Profit Operating (Controllable) Expenses Other (Noncontrollable) Expenses Rent Depreciation Interest Total NonControllable Expenses \begin{tabular}{|l|l|} \hline 1.27% & 1.20% \\ \hline 0.32% & 0.44% \\ \hline 0.19% & 0.22% \\ \hline 1.78% & 1.86% \\ \hline \end{tabular} 45 \begin{tabular}{|lrl|} \hline Income Before income Taxes & $34,000 & 545,000 \\ \hline \end{tabular} Tab 1 - Vertical Tab 2-Horizontal Base Year Operating (Controllable) Expenses Operating income $8,000[$62,000 Other (Noncontrollable) Expenses $79,000 15 Income Before Income Taxes Tab 1 - Vertical Tab 2-Horizontal Base Year Tab 1 - Vertical Tab 2-Horizontal Base Year Other (Noncontrollable) Expenses 46 47 \begin{tabular}{l|l|l|l} Tab 1 - Vertical & Tab 2-Horizontal Base Year \end{tabular} \begin{tabular}{|l|r|r|r|r|r|r|} \hline Revenues & 201 & 202 & Change & 201 & 202 & Change \\ \hline Food & $1,300,000 & $1,500,000 & & 82.54% & 81.97% & \\ \hline Beverage & $250,000 & 5300,000 & & 15.87% & 16.39% & \\ \hline Other & $25,000 & 530,000 & & 1.59% & 1.64% & \\ \hline & & & & & & \\ \hline Total Revenues & $1,575,000 & 51,830,000 & & 100.00% & 100.00% & \\ \hline \end{tabular} Cost of Sales \begin{tabular}{|l|l|l|l|l|l|} \hline Total Cost of Sales & $493,000 & 5541,000 & 31.30% & 29.56% & \\ \hline \end{tabular} Gross Profit Operating (Controllable) Expenses Other (Noncontrollable) Expenses Rent Depreciation Interest Total NonControllable Expenses \begin{tabular}{|l|l|} \hline 1.27% & 1.20% \\ \hline 0.32% & 0.44% \\ \hline 0.19% & 0.22% \\ \hline 1.78% & 1.86% \\ \hline \end{tabular} 45 \begin{tabular}{|lrl|} \hline Income Before income Taxes & $34,000 & 545,000 \\ \hline \end{tabular} Tab 1 - Vertical Tab 2-Horizontal Base Year Operating (Controllable) Expenses Operating income $8,000[$62,000 Other (Noncontrollable) Expenses $79,000 15 Income Before Income Taxes Tab 1 - Vertical Tab 2-Horizontal Base Year