Answered step by step
Verified Expert Solution
Link Copied!

Question

1 Approved Answer

Please complete week 1 through 6 in the chart for Q8. No extra information needed thank you Consider the output and labor hour figures shown

Please complete week 1 through 6 in the chart for Q8. No extra information needed thank you image text in transcribed
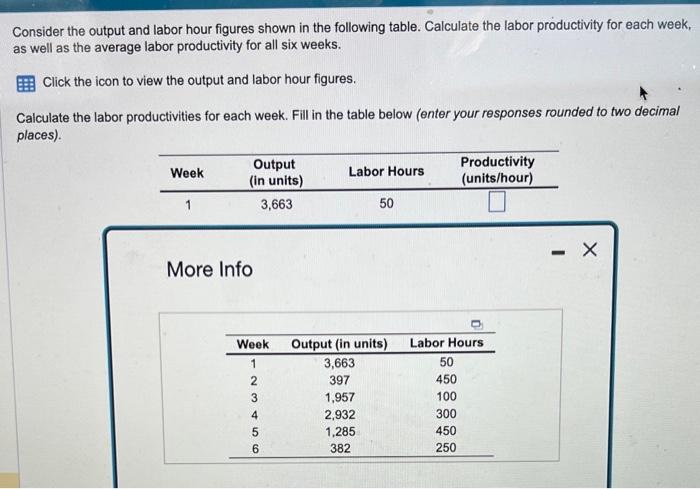
Consider the output and labor hour figures shown in the following table. Calculate the labor productivity for each week, as well as the average labor productivity for all six weeks. Click the icon to view the output and labor hour figures. Calculate the labor productivities for each week. Fill in the table below (enter your responses rounded to two decimal places). More Info

Step by Step Solution

There are 3 Steps involved in it

Step: 1

blur-text-image

Get Instant Access to Expert-Tailored Solutions

See step-by-step solutions with expert insights and AI powered tools for academic success

Step: 2

blur-text-image

Step: 3

blur-text-image

Ace Your Homework with AI

Get the answers you need in no time with our AI-driven, step-by-step assistance

Get Started

Recommended Textbook for

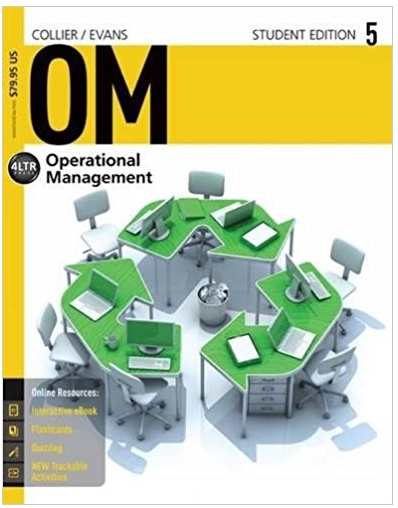
OM operations management

Authors: David Alan Collier, James R. Evans

5th edition

1285451376, 978-1285451374

More Books

Students also viewed these General Management questions